Running a restaurant in today’s competitive environment demands more than intuition or tradition. Restaurant owners and managers are increasingly turning to analytics tools to make smarter, faster, and more profitable decisions.
Analytics tools transform raw data—from point of sale systems, inventory logs, staff scheduling software, guest feedback, and delivery apps—into actionable insights. By applying descriptive, predictive, and prescriptive analytics, restaurants can optimize operations, reduce waste, enhance customer experience, and boost profitability.
In this article, we explain how analytics tools improve restaurant decision-making, explore different types of analytics, describe key use cases, discuss implementation challenges and best practices, and answer frequently asked questions.
Descriptive, Predictive, and Prescriptive Analytics in Restaurants
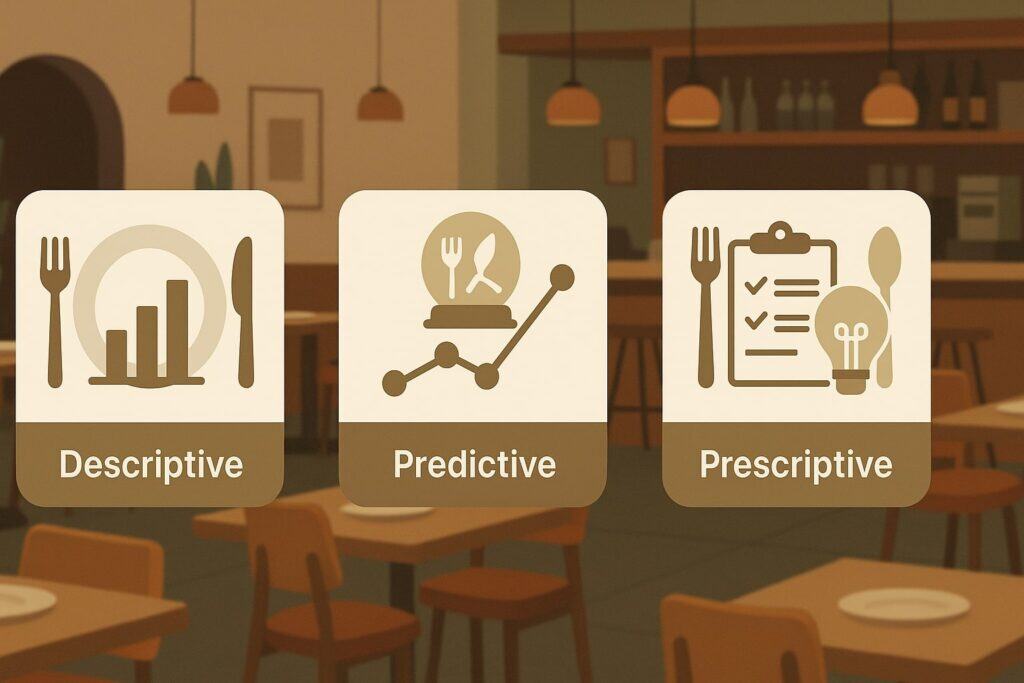
Descriptive Analytics: Understanding What Happened
Descriptive analytics is the foundation of any analytics-driven approach. In the restaurant context, descriptive analytics involves collecting, aggregating, and summarizing historical data to understand trends, performance, and anomalies.
With descriptive analytics, a restaurant can view dashboards and reports that show sales per item, daily revenue trends, peak hours, customer footfall, staff performance, inventory consumption, waste volume, and so on.
The goal is to answer questions like: What sold best last month? Which menu items are underperforming? How did staff sales compare across shifts? Where was excess food wasted?
A modern analytics tool enables real-time dashboards that constantly update as new sales or operations data flows in. Rather than waiting until end-of-day or end-of-week reports, managers can monitor live metrics and identify issues as they emerge.
Descriptive analytics thus makes decision-making transparent, grounded in fact, and less subject to guesswork or anecdotal bias. For instance, you may notice that one menu item is consistently low-selling in certain time slots, or that staff performance varies significantly by shift. That insight can lead to menu pruning, staff reallocation, or targeted promotions.
Moreover, descriptive analytics provides key performance indicators (KPIs) such as average daily cover count, average transaction value, table turnover, food cost percentage, labor cost percentage, waste ratio, and more.
These KPIs allow comparison over time (month to month, year to year), across locations (for chains), or against industry benchmarks. With strong descriptive analytics, restaurant leadership gains situational awareness and a factual baseline from which more advanced analytics (predictive, prescriptive) can build.
Predictive Analytics: Forecasting What Will Happen
While descriptive analytics tells you what has happened, predictive analytics ventures into what is likely to happen next. Predictive models combine historical data with statistical techniques, machine learning, and external variables (seasonality, weather, holidays, local events) to forecast future outcomes.
For a restaurant, that might mean predicting daily or hourly demand, anticipating which menu items will be popular, estimating staffing needs, or projecting food stock usage.
For instance, a predictive analytics system may use past data to forecast that on Friday evenings during monsoon, demand may dip by 10 %, or that a school holiday leads to a surge in dessert orders.
By understanding these patterns, the restaurant can adjust inventory orders ahead of time—avoiding overstocking or understocking. Predictive analytics can also help anticipate customer traffic, enabling management to schedule staff accordingly, reducing overstaffing or understaffing and thus optimizing labor cost.
Another predictive use case is menu optimization. By analyzing correlations between promotions, pricing, and demand, predictive analytics can suggest which items will sell more under different pricing or bundling strategies.
Over time, these models improve as more data is collected, refining their accuracy. Predictive analytics can also help with forecasting maintenance needs, equipment downtimes, or expected churn in loyalty customers.
In the restaurant industry, predictive analytics is increasingly essential: chains and even single-location restaurants now rely on forecasting to align supply chain, staffing, and marketing planning. It moves decision-making from reactive to proactive.
Prescriptive Analytics: Recommending What to Do
Prescriptive analytics is the most advanced form of data analytics. It goes beyond forecasting—suggesting concrete actions to optimize outcomes—and can simulate multiple “what-if” scenarios.
In a restaurant, prescriptive analytics might recommend which menu items to promote, the ideal stock reorder quantities, how to respond when demand surges, or how to restructure staff schedules in real time.
For example, if predictive analytics forecasts a lunch rush beyond a threshold, prescriptive algorithms might recommend adding a prep cook two hours earlier, or switching a server from side duties to floor duties.
If inventory is running low on a high-demand ingredient, prescriptive analytics can suggest which products to substitute or whether to order express delivery from suppliers. In pricing, prescriptive models might propose dynamic pricing or limited-time promotions based on demand elasticity.
Prescriptive analytics in business is seen as the “final frontier” of analytics capability: it uses optimization algorithms, constraints, simulation, rules engines, and machine learning to prescribe optimal decisions.
In restaurant operations, the adoption of prescriptive analytics remains nascent but is growing—especially in large chains with integrated systems. As computation power, AI, and data infrastructure advance, prescriptive analytics tools are becoming more accessible for smaller restaurants too.
When descriptive, predictive, and prescriptive analytics are used together, a restaurant’s decision-making becomes data-driven, anticipatory, and optimized—rather than reactive, delayed, or subjective.
Key Domains Where Analytics Tools Transform Restaurant Decisions
Analytics tools offer impact across multiple domains in restaurant operations. Below are major areas where analytics drives better decision-making and business outcomes.
Menu Engineering and Optimization
One of the most strategic uses of analytics tools in a restaurant is menu engineering: deciding which dishes stay, which get removed, how to price them, and how to promote them.
Analytics tools can classify menu items into categories such as “stars” (high profitability, high popularity), “plowhorses” (high popularity, low margin), “puzzles” (low popularity, high margin), and “dogs” (low both).
Based on this, management can redesign the menu to emphasize profitable and popular items, eliminate underperformers, or adjust pricing.
Analytics can also study cross-selling patterns—i.e., which appetizers sell when paired with which mains. Through basket analysis (market basket modeling), one can suggest upsells or bundled combos (e.g. “add dessert at 20% off”) to increase the average ticket size.
Seasonal trends, day-of-week behavior, and external factors (weather, local events) can be overlaid on menu performance, so the restaurant can rotate or promote seasonal items intelligently.
Further, A/B testing can be run: present two versions of menu design or price points to different segments of customers and use analytics to measure incremental revenue or uptake. Over time, menu optimization becomes iterative and continuously refined.
With analytics, menu changes are no longer guesses — they’re data-driven decisions that align with demand, cost, and profitability.
Inventory Control and Waste Reduction
Food cost and waste are among the largest controllable expenses in restaurants. Analytics tools play a critical role in managing inventory and reducing waste. Descriptive analytics helps track inventory usage, identify spoilage or leakages, and highlight mismatches between predicted and actual consumption.
Predictive analytics forecasts inventory demand by ingredient and time period. Prescriptive analytics then recommends reorder quantities or substitutions based on supplier lead times, minimum order quantities, and predicted usage.
Effective integration of analytics with inventory management helps alert managers when stock levels deviate, flag ingredients nearing expiry, or detect anomalies (e.g. sudden spikes in usage indicating theft or error).
Restaurants that implement these systems report significant waste reductions (sometimes 10–15 % or more) and better margins.
Additionally, inventory analytics can help in supplier selection and negotiation—by comparing supplier cost histories, lead times, and quality variance. That enables smarter procurement decisions and cost savings.
Labor Management and Scheduling
Labor cost is a major expense in restaurant operations. Analytics tools help balance the twin imperatives of service quality and labor efficiency. Descriptive analytics shows how staffing levels align (or misalign) with demand, productivity by shift, and overtime incidence.
Predictive models forecast customer traffic and peak periods. Prescriptive analytics can propose optimal staffing schedules and shift assignments to meet predicted demand while minimizing labor cost.
For example, if forecasts show a lull in demand post-lunch, the system might reduce staff on hand, or reassign employees to cleaning, prep, or upsell tasks. During forecasted surges, it may suggest bringing in part-time help or calling in additional servers.
Over time, the scheduling logic learns thresholds, constraints (like labor laws, max working hours), and performance trade-offs.
When scheduling is data-driven rather than based on intuition, labor cost as a percentage of sales can be optimized without compromising service.
Customer Insights, Retention, and Personalization
Analytics tools allow restaurants to dive deeply into customer behavior, preferences, and retention. By integrating POS data, loyalty programs, reservation systems, and feedback platforms, restaurants can segment customers (e.g. high frequency, high spend, occasional) and understand ordering habits (favorite items, peak visit times, spending patterns).
Predictive analytics can identify customers who are likely to churn or reduce spend, prompting targeted retention campaigns (discounts, personalized offers). Prescriptive analytics may suggest which promotion or message would be most effective per individual.
Further, restaurants can personalize offers (e.g. “Your favorite pasta is 20% off tonight”) or cross-sell complementary items. Personalization enhances customer experience and deepens loyalty. Analytics also help measure the ROI of marketing campaigns (e.g. email, SMS, push), tying spend to incremental revenue and adjusting future campaigns accordingly.
Operations Optimization and Service Efficiency
Analytics tools provide visibility into process bottlenecks—such as kitchen throughput, order preparation times, table turnover, and service delays. By analyzing order timestamps, prep times, delivery intervals, and staff performance, managers can identify inefficiencies like a slow kitchen station, misallocation of servers, or under-utilized capacity.
Predictive models can forecast congestion times, and prescriptive tools can recommend tactics (e.g. pre-cook ingredients, reassign staff, delay non-priority tasks) to smooth the workflow. Over time, operations become more streamlined, waiting times reduce, and capacity utilization improves.
Dynamic Pricing, Promotions, and Revenue Management
Some advanced restaurants are now applying analytics for dynamic pricing and revenue management—akin to what airlines and hotels do. Analytics can assess demand elasticity, competitor pricing, day/time trends, and external variables to adjust prices or offer time-sensitive deals.
For example, for slower lunch hours, a special discount may stimulate demand; for peak dinner hours, small surcharges or limited-time upsell offers may optimize revenue.
With prescriptive analytics, the system can test and propose promotion strategies—bundle deals, happy-hour discounts, loyalty incentives—and simulate their effects on revenue, margin, and customer flow. Over time, pricing strategies become more agile and aligned with demand patterns.
Multi-Location & Chain Management
For restaurant groups or chains, analytics tools enable consolidated reporting across multiple outlets. Chain-level dashboards help compare performance across stores, identify underperforming units, and benchmark against top stores.
Analytics can flag anomalies, share best practices, and coordinate procurement. A unified analytics platform allows leadership to detect geographic trends, shift focus to regional opportunities, and manage expansion more intelligently.
Implementation: How to Get Analytics Tools Running in a Restaurant
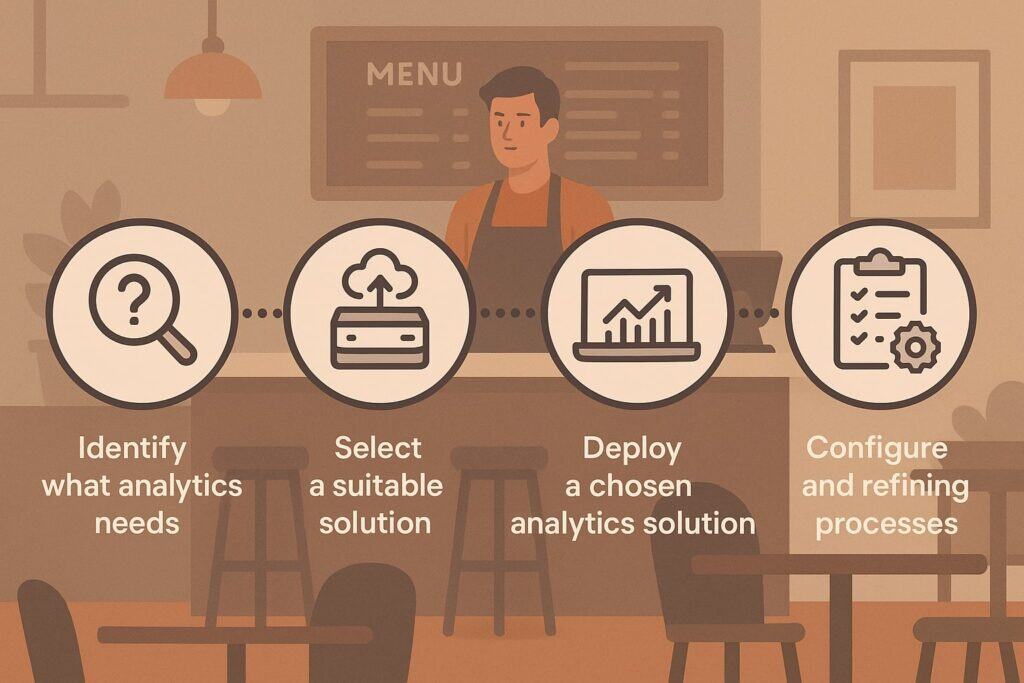
Implementing analytics tools in a restaurant is often the harder step. Below is a practical guide to doing it well.
Data Integration and Infrastructure
The first task is to ensure all relevant data sources feed into the analytics engine. Common sources include:
- POS (point-of-sale) systems (sales, discounts, promotions)
- Inventory / purchasing systems
- Staff scheduling / payroll systems
- Reservation / table management systems
- Online ordering / delivery platforms
- Loyalty / CRM systems
- Feedback / survey systems
- External data (weather, local events, competitor pricing)
You may need middleware or APIs to consolidate and normalize data into a central data warehouse or data lake. Ensuring clean, reliable, and consistent data is critical. Data infrastructure (cloud or on-premises) must support storage, processing, and analytics workloads.
Choosing the Right Analytics Tool
When selecting an analytics tool, consider:
- Integration capabilities (POS, inventory, delivery platforms)
- Real-time dashboarding and reporting
- Predictive and prescriptive analytics modules
- Scalability (if multiple locations or future growth)
- Ease of use and intuitive UI (so managers adopt it)
- Support and training
- Cost structure (subscription, usage-based, licensing)
- Security and data privacy
Examples of restaurant-focused analytics or BI platforms include Restroworks RestroBI, CrunchTime, Toast BI, Upserve (with analytics), etc.
Incremental Rollout and Training
Start small—pick a single location or a subset of metrics to track. Roll out dashboards and training in phases to allow staff to adapt. Train managers and operational users (chefs, floor managers, procurement) to read and act on analytics. Encourage regular use—daily metrics reviews, performance meetings, KPI tracking.
Ensure feedback loops: users should suggest improvements, new metrics, or layout tweaks. With time, the analytics system becomes intrinsic to decision routines.
Establishing Key Metrics and Targets
Define your primary KPIs upfront (sales growth, food cost %, labor cost %, average ticket, table turnover, waste percentage, customer satisfaction). Set realistic baseline targets and thresholds. Use analytics to monitor progress and flag deviations. Visual dashboards with color-coded alerts help managers act when metrics fall out of range.
Continuous Improvement and Model Refinement
Analytics models improve with more data and feedback. Monitor model accuracy, refine prediction algorithms, recalibrate thresholds, and adapt prescriptive rules. Periodically review metrics, remove stale ones, and add new ones. That iterative process ensures the analytics engine remains relevant as your business evolves.
Governance, Privacy, and Security
Managing access control, data quality, privacy (customer PII), and compliance is essential. Only authorized users should access sensitive dashboards. Anonymize or aggregate customer-level data if necessary. Ensure backups and disaster recovery. Regular audits help maintain trust and integrity.
Challenges, Risks, and Mitigation Strategies
Even though analytics tools offer big benefits, there are pitfalls to watch out for.
Data Quality and Silos
Bad data leads to bad decisions. If sources are inconsistent, missing, or duplicated, analytics outputs may mislead. Data silos—isolated systems disconnected from the analytics pipeline—prevent unified insights. Mitigation: invest time in data cleaning, integration, ETL (extract-transform-load) processes, and normalization.
Resistance to Change / Culture
Restaurant staff or managers may resist adopting analytics-driven decisions (preferring intuition or prior tradition). Without buy-in, the tool becomes unused. Mitigation: involve stakeholders early, show quick wins, train users, and make dashboards easy to use. Also demonstrate ROI clearly to build trust.
Cost and Complexity
Some analytics platforms may have high costs or require technical skills (data engineers, analysts). Smaller restaurants may hesitate. Mitigation: begin with simpler BI tools or modular analytics, adopt cloud-based tools, or work with consultants.
Over-reliance on Models
Analytics models are probabilistic, not guaranteed. Overreliance without human oversight can backfire—especially in exceptional events (sudden supply disruption, social events, regulation changes). Mitigation: always combine analytics with domain expertise and keep humans in the loop.
Privacy and Ethical Concerns
Using customer-level analytics and personalization raises privacy risks. Be transparent about data use, comply with local laws (e.g. GDPR, local data protection regulations), and anonymize data where necessary.
Scalability and Integration Overhead
As restaurants expand or integrate new platforms, scaling analytics systems or integrating new data sources becomes more complex. Mitigation: choose scalable architecture early, use APIs and modular designs, and periodically refactor the data architecture.
Latest Trends and Innovations in Restaurant Analytics
Analytics in restaurants is evolving rapidly. Below are some current trends shaping the future of decision making.
AI, Machine Learning, and Deep Learning
Advanced AI models are being adopted to better forecast demand under multiple variables, optimize dynamic pricing, personalize customer experience, and detect anomalies in operations.
Restaurants are integrating computer vision (e.g. cameras in kitchens to track cooking status) and voice recognition (voice ordering) to capture data and optimize workflows. For example, Yum Brands is deploying AI voice-ordering in drive-thrus, supported by Nvidia, to optimize ordering accuracy and operations.
Cloud Kitchens and Delivery Analytics
With the surge of cloud kitchens or ghost kitchens, analytics must account for delivery metrics, routing optimization, third-party aggregators, and delivery times.
Planning-based algorithmic systems (for example, to solve vehicle routing with time windows) are being used to optimize delivery dispatch and scheduling. Integration with delivery platforms and real-time dispatch decisions is now critical.
Real-time and Edge Analytics
Rather than lagging reports, restaurants are moving toward real-time data streams and edge analytics—decision logic runs close to the point of data generation (e.g., kitchen, point-of-sale terminal). That accelerates responsiveness and enables immediate action.
Augmented Analytics and Natural Language Interfaces
New analytics tools offer augmented analytics: automated insights and suggestions generated by AI without manual queries. Also, natural language interfaces allow users to ask questions like “Which menu items lost money this week?” and get responses instantly.
Voice and Conversational Analytics
Analytics integrated into voice assistants (for managers) or chatbots can allow natural conversational queries and insights on demand.
Benchmarking and Industry Intelligence
Analytics platforms are offering anonymized benchmarking across peer restaurants—letting you compare your performance to industry averages or top quartile performers. That sets aspirational goals and reveals relative gaps.
Sustainability and Green Analytics
Restaurants are beginning to instrument sustainability metrics: food waste, carbon footprint per dish, energy usage, water usage, etc. Analytics helps decision-making in eco-friendly operations, waste reduction, and cost savings.
FAQs (Frequently Asked Questions)
Q1: Do small or independent restaurants benefit from analytics tools, or is this only for large chains?
A1: Absolutely, even small restaurants can benefit. While large chains have scale advantages, analytics tools are decreasing in cost and complexity. Even a single-location restaurant can start with basic BI dashboards, POS integrations, and KPI tracking.
Over time, as data accumulates, they can adopt forecasting or prescriptive modules. The key is starting small, focusing on high-impact metrics (food cost, waste, most popular items), and building a data-driven culture.
Q2: How long does it take to see ROI (Return on Investment) from implementing analytics?
A2: The timeline depends on the scope and maturity of the implementation. Many restaurants see measurable gains within 3–6 months in areas like waste reduction, labor alignment, and inventory optimization.
ROI is driven by cost savings (less waste, better procurement, optimized labor) and increased revenue (menu tweaks, promotions). With continued usage, benefits compound over time.
Q3: How accurate are predictive models in restaurant analytics?
A3: Predictive models are probabilistic and not perfect; accuracy depends on data quality, feature variables, model sophistication, and external factors (weather, events).
But with consistent refinement and feedback, they can reach high fidelity (e.g. forecasting demand within a small error margin). Moreover, combining analytics with managerial judgment mitigates risk of blind reliance. The models help inform—not replace—decision making.
Q4: What kind of staff or resources are needed to run restaurant analytics?
A4: Initially, you’ll need a project lead (could be a manager or operations person) and support from the IT/data team (or external vendor). Technical skills in data integration, ETL, and dashboarding help.
Over time, a data analyst or business intelligence specialist is useful. But many analytics tools today are designed for non-technical users, with drag-and-drop dashboards, embedded insights, and guided workflows.
Q5: Can analytics help with customer satisfaction and experience?
A5: Yes—analytics tools can monitor sentiment via surveys, social media, and feedback channels. They help tie service metrics (wait times, order accuracy, repeat visits) to revenue.
Personalization analytics helps tailor offers, loyalty rewards, and upselling combos to customer preferences. Over time, improved experience boosts retention and brand reputation.
Q6: Is predictive or prescriptive analytics necessary, or is descriptive enough?
A6: Descriptive analytics is a great start and essential for understanding the baseline. But to unlock full potential, predictive analytics helps you anticipate demand, and prescriptive analytics suggests actions.
Descriptive alone is reactive; combining all three transforms decision-making from reactive to proactive and optimized. As technology evolves, more restaurants are adopting predictive and prescriptive capabilities.
Conclusion
Analytics tools are no longer optional extras for restaurants—they are strategic imperatives. By leveraging descriptive, predictive, and prescriptive analytics, restaurant owners and managers can make informed, data-driven decisions across menu optimization, inventory control, labor scheduling, customer personalization, operations, and revenue management.
The benefits are tangible: reduced waste, improved margins, better staffing efficiency, higher customer satisfaction, and sustainable growth.
The path to analytics adoption requires thoughtful planning: integrating data sources, selecting appropriate tools, rolling out incrementally, establishing key metrics, training users, and continuously refining models.
Although challenges such as data quality, resistance to change, and cost must be managed, early wins and user buy-in often pave the way for long-term success.
In today’s fiercely competitive restaurant industry, analytics tools give establishments the ability to anticipate shifts, respond quickly, and stay ahead.
Decision-makers who embrace analytics will find themselves better equipped to manage uncertainty, optimize every aspect of operations, and deliver superior dining experiences—all while improving profitability.