Food waste is a pervasive global problem. Every year, vast quantities of edible food are lost or discarded, translating not only into environmental harm but also into significant financial losses. Leveraging data and analytics offers a promising pathway to shrink waste and cut costs across the food supply chain.
In this article, we explore how organizations—from farms and processors to retailers, restaurants, and households—can use data strategies and digital tools to detect inefficiencies, forecast demand, optimize operations, and ultimately reduce both food waste and associated costs.
The Scale and Impact of Food Waste
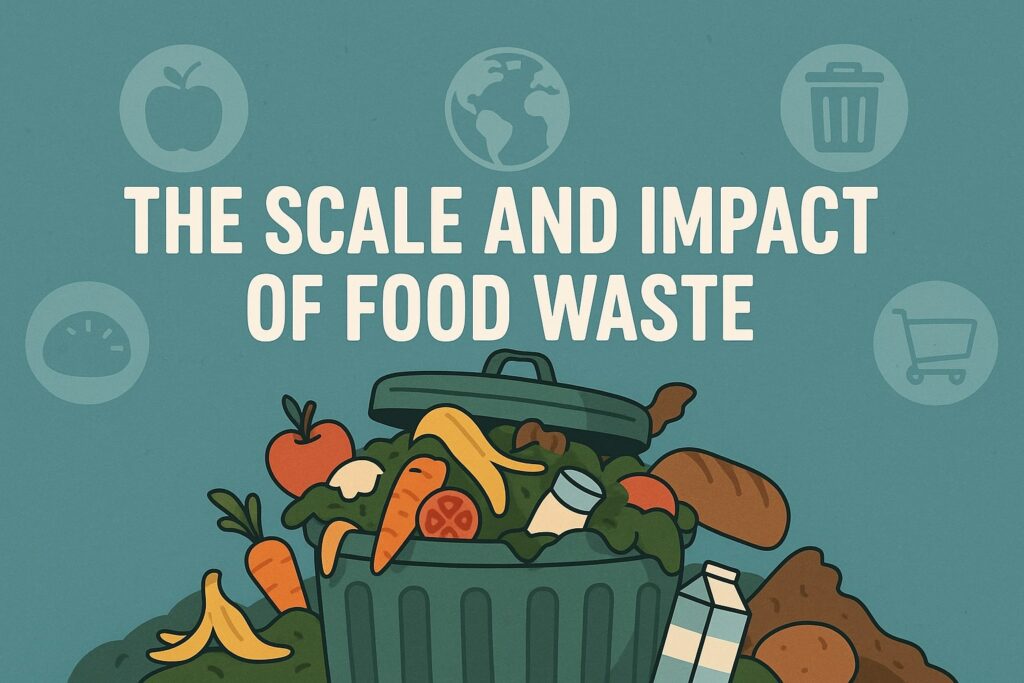
Food waste is not just a moral or environmental issue: it carries enormous economic, social, and ecological costs.
According to the 2024 United Nations Environment Programme (UNEP) Food Waste Index Report, food waste contributes 8–10 % of global greenhouse gas emissions, involves the misuse of nearly 30 % of agricultural land, and results in about USD 1 trillion in losses globally.
In practical terms, food waste spans from farm fields to consumers’ plates. Losses may occur during harvesting, processing, transportation, storage, retail, and final consumption.
Each stage presents different causes—pests or weather on farms, spoilage or packaging damage during transport, unsold inventory in stores, or leftovers at restaurants and homes.
From a cost perspective, wasted food means wasted input costs (seeds, water, labor, fertilizers), processing expenses, transport, packaging, and disposal. For businesses, the effect is directly on margins. In many restaurants, 4-10 % of purchased food never reaches a customer, translating into 5.6 % (or more) of sales lost to waste.
Moreover, the environmental footprint is steep: rotting food in landfills emits methane, a potent greenhouse gas. The water, land, energy, and fertilizer used to produce wasted food are lost as well. Food rescue efforts (recovering edible surplus) are one component of combating waste.
Because of the magnitude, reducing food waste is a priority for sustainability goals such as the UN’s SDG 12.3, which aims to halve per capita global food waste (retail + consumer levels) by 2030.
Given these stakes, data-driven strategies are not optional—they are essential. Data provides the lens to see hidden waste, inform decisions, measure progress, and enforce accountability. In the sections that follow, we delve into how data is collected, transformed into insight, and turned into action to cut waste and cost.
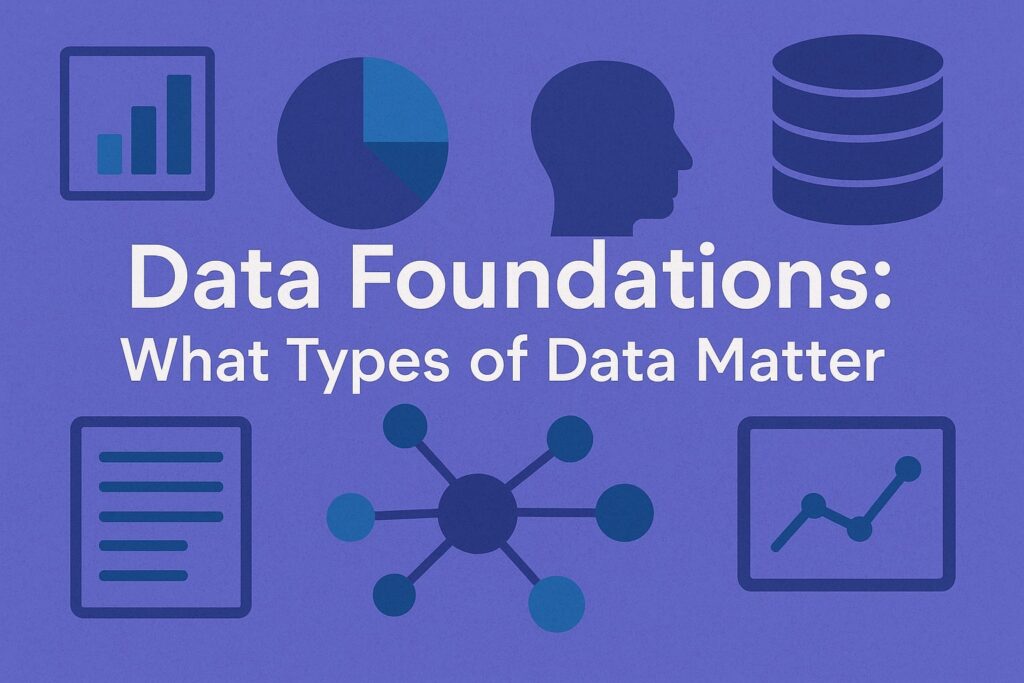
Data Foundations: What Types of Data Matter
To reduce food waste and cost using data, one must first build a strong foundation of relevant, high-quality data. Without that, any analysis is superficial or misleading. Below we discuss key data types, sources, and common challenges.
Quantitative vs. Qualitative Data
Data relevant to food waste reduction can be broadly divided:
- Quantitative data: measurable, numeric values such as weights, volumes, costs, counts, percentages, timestamps, shelf lives, temperature readings.
- Qualitative data: descriptive information like reasons for spoilage (e.g. “left on shelf too long”, “broken packaging”), consumer feedback, staff observations, or supplier quality issues.
Quantitative data forms the backbone of analytics; qualitative data helps interpret anomalies or guide root-cause analysis.
Key Data Categories
Some major categories of data required include:
- Purchasing & Procurement Data
- Invoices, costs per unit, lot numbers, supplier, delivery dates, order sizes.
- This shows ingredient or product cost, incurred spend, and supplier performance.
- Invoices, costs per unit, lot numbers, supplier, delivery dates, order sizes.
- Inventory & Stock Data
- Real-time stock levels, replenishment events, expiry dates, arrival vs. departure logs.
- Helps in tracking how fast items move and spotting overstock or slow-moving goods.
- Real-time stock levels, replenishment events, expiry dates, arrival vs. departure logs.
- Sales / Point-of-Sale (POS) Data
- Transaction-level data: what was sold, how many units, when, price, discounts.
- Useful for correlating demand to waste and forecasting.
- Transaction-level data: what was sold, how many units, when, price, discounts.
- Recipe / Yield / Production Data
- Recipes or Bill of Materials (BOM) for dishes or processed goods.
- Yield information (e.g. raw weight to usable food weight) helps compute waste or trim losses.
- Recipes or Bill of Materials (BOM) for dishes or processed goods.
- Waste Tracking / Disposal Data
- Weight or volume of wasted food by category (vegetables, dairy, meat, plate waste, trim waste).
- Time, location (kitchen station, shift), and reason (expired, overproduction, spoiled).
- This is critical: you cannot reduce what you do not measure.
- Weight or volume of wasted food by category (vegetables, dairy, meat, plate waste, trim waste).
- Sensor / IoT / Environmental Data
- Temperature, humidity, light exposure in storage or transport.
- Motion sensors or camera data in kitchen bins, smart scales weighing discarded food, etc.
- Temperature, humidity, light exposure in storage or transport.
- External / Contextual Data
- Weather, public holidays, local events, promotional campaigns.
- Consumer preferences, macro trends, supply chain disruptions.
- Weather, public holidays, local events, promotional campaigns.
Data Challenges & Silos
A crucial challenge is that data is often siloed: procurement tools may live separately from POS systems, which may be divorced from waste logs. Integration is essential for a full “farm-to-fork” view.
Other challenges include inconsistent data quality (missing entries, measurement errors), differences in units (kg, lb, pieces), delays in logging, or manual entry errors. Overcoming these issues requires consistent hygiene practices, staff training, and validation rules.
Furthermore, real-time or near-real-time data is ideal—if waste or anomalies are logged days later, corrective actions may come too late. Hence systems often aim to automate data collection (e.g. via IoT sensors, smart scales, automated logs) to minimize human error and latency.
In sum, building a robust data foundation is the first essential step. Data itself does not reduce waste; but good data enables smarter analytics, which then supports decision-making. Next, we examine how analytics transforms data into insight and action.
Analytics Methods & Tools: Turning Data into Insight
Once reliable data is flowing, analytics methods help uncover patterns, forecast problems, and prescribe corrective actions. Below we explore common analytic layers and tools used in food waste reduction.
Descriptive, Diagnostic, Predictive, Prescriptive Analytics
Analytics typically progresses through stages:
- Descriptive Analytics
- What happened? For example, total waste by category, cost of waste by month, trends over time.
- Baseline dashboards and summary reports.
- What happened? For example, total waste by category, cost of waste by month, trends over time.
- Diagnostic Analytics
- Why did it happen? Correlations and root-cause exploration: e.g. high waste at dinner shift or at a particular kitchen station.
- Drill-downs, filtering, segmentation.
- Why did it happen? Correlations and root-cause exploration: e.g. high waste at dinner shift or at a particular kitchen station.
- Predictive Analytics
- What is likely to happen next? Using historical patterns, seasonality, external signals to forecast demand or waste risks.
- Machine learning models or time-series forecasts.
- What is likely to happen next? Using historical patterns, seasonality, external signals to forecast demand or waste risks.
- Prescriptive Analytics
- What should we do? Recommending adjustments: reduce order quantity, shift production schedule, introduce dynamic pricing, or reallocate staff.
In practice, many organizations begin with descriptive and diagnostic analytics, then gradually integrate predictive and prescriptive models.
Tools & Technologies
To support these analytics, a combination of systems is commonly used:
- Business Intelligence (BI) & Dashboard Tools: Tools like Power BI, Tableau, Looker, or custom dashboards help visualize waste, cost, trends, and comparisons.
- ERP / Integrated Suites: Many enterprise resource planning (ERP) systems include modules for inventory, procurement, production, and waste.
- Food Cost Analytics Platforms: Specialized solutions focus on food cost, waste tracking, recipe management, and integration with POS/ERP systems.
- IoT Devices & Smart Sensors: Smart scales, bin sensors, temperature/humidity sensors, RFID / barcode scanners help automate data collection.
- Machine Learning / AI Modules: Algorithms can predict spoilage risks, optimize ordering, detect anomalies, or identify underutilized inventory.
- Computer Vision / Image Recognition: Advanced systems use cameras to identify food items and classify waste, either in bins or during plate clearance.
- Integration & Data Pipelines: Tools like data lakes, ETL (extract-transform-load), APIs, and data warehouses stitch together disparate systems (procurement, POS, inventory, waste logs). The Google Cloud blog describes how data pipelines help break silos and produce real-time insights.
Applications of Analytics in Action
Here are some real-world uses:
- Demand Forecasting & Dynamic Ordering: Machine learning models incorporate seasonality, events, promotions, and historical sales to estimate demand. This reduces overordering and minimizes spoilage.
- Waste Hotspot Detection: Analytics can flag kitchen stations, shifts, or recipes that consistently generate excessive waste. This helps managers focus intervention efforts.
- Menu Engineering & Ingredient Rationalization: Identify menu items with high waste-to-sales ratio; revise or remove them. Also consolidate ingredients to reduce small leftover volumes.
- Portion Optimization: Track plate waste data and adjust portion sizes dynamically to cut waste without diminishing perceived value.
- Dynamic Pricing & Promotions: Offer discounts or bundle items that are approaching expiry—data models can trigger offers in time to sell rather than waste.
- Supplier & Lead-Time Optimization: Analytics can measure supplier performance in terms of spoilage, consistency, and delivery delays; reorder schedules can be optimized accordingly.
- Preventive Maintenance & Cold Chain Monitoring: Real-time sensor data can alert if storage temperature deviates, enabling timely intervention to prevent spoilage.
- AI & Computer Vision for Waste Recognition: Some systems (e.g. Winnow) use cameras and scales to identify what is being thrown away. In hospitality settings, these systems reduced kitchen waste by 76 % and post-consumer waste by 55 % in pilot sites.
- Shelf-life Prediction & Expiry Algorithms: Systems like SLED use machine learning to more accurately predict spoilage than simple “best by” dates, thereby reducing premature disposal.
When deployed correctly, analytics transforms raw numbers into actionable levers—businesses can test, evaluate, and refine interventions over time. The next section examines how these techniques are applied across different sectors.
Sector Applications: Farms, Processors, Retail, Hospitality
Data-driven approaches to reducing food waste and costs differ in emphasis and challenges depending on the sector. Below is how analytics plays out across key stages.
Agricultural & Farm Level
At the farm/producer level, food loss (pre-retail) is a dominant concern. Data helps in:
- Crop Planning & Demand Matching: Using market forecasts, pricing signals, and historical demand data, farmers can choose which crops to plant and in what quantities to avoid overproduction.
- Yield & Quality Analytics: Track yield per field, per seed batch, or per fertilizer regime. Identify practices or suppliers that produce lower loss rates.
- Harvest Scheduling & Logistics: Analytics help farmers schedule harvests to minimize spoilage, align with transport availability, and prevent delays.
- Byproduct Utilization & Circular Use: Monitor waste streams (peels, pulp) and convert them to compost, feed, or secondary products. Analytics can help identify the most valuable uses.
Overall, the farm-level analytics focus more on predictive planning and logistical optimization rather than immediate waste tracking.
Food Processing & Manufacturing
In processing and food manufacturing, micro-waste and trimming losses are important. Analytics helps by:
- Process Efficiency Monitoring: Track line yield, machine stoppage, rejects, waste by shift, and identify bottlenecks.
- Batch-level Traceability: Monitor which production lots lead to higher scrap; feed that back to QA or supplier evaluation.
- Optimization of Process Parameters: Use sensor and process data (temperature, flow, pressure) to fine-tune operations and reduce waste margin.
- Quality & Defect Analytics: Detects causes of rework or rejection (e.g. foreign objects, sorting errors) and reduces frequency via root-cause models.
- Waste Minimization via Side Streams: Identify side-stream waste (e.g. trimmings, skins) and monetize or reuse them.
- Predictive Maintenance: Integrate equipment health data to prevent breakdowns or misalignments that contribute to waste.
Here, the data systems often operate at high volumes and high speed; analytics must scale accordingly.
Retail & Grocery Sector
Retail sees many losses due to unsold perishables, markdowns, and expiry. Analytics can help:
- Demand Forecasting & Replenishment Optimization: Use historical sales, promotions, seasonality, and external signals to plan order sizes.
- Expiry Monitoring & First-Expire, First-Out (FEFO): Track inventory by batch and expiration; promote or discount items nearing expiry.
- Assortment Planning & SKU Rationalization: Evaluate which products sell slowly or have high waste and remove or adjust them.
- Dynamic Promotions & Markdown Strategies: Trigger markdowns automatically based on projected spoilage risk.
- Waste Audit & Spoilage Analytics: Perform regular waste audits to see which categories are most wasted and why. Use that to prioritize interventions.
- Cross-store Comparison & Benchmarking: For a retail chain, benchmark stores against each other to uncover best practices.
- Data-Driven Donations or Redistribution: Identify surplus that can be donated or redistributed just in time.
Retail analytics often must integrate POS, inventory, demand forecasting, and waste logs into a unified system. Google Cloud has described how cloud data platforms can break silos and provide real-time insights in retail operations.
Hospitality / Restaurants / Food Service
In restaurants or catering, waste is often from overproduction, trim waste, plate scraps, or menu misalignment. Analytics helps by:
- Menu & Portion Engineering: Use sales vs waste data to phase out high-waste dishes, adjust ingredient combinations, or adjust portion sizes. Restaurants using analytics have reduced food waste by 26 % within a year, and many recouped their investment within two years.
- Demand Forecasting for Services: Based on reservations, historical trends, weather, and events, estimate how many covers to prepare.
- Station-level Waste Tracking: Monitor waste by kitchen department (grill, prep, salad) or shift to isolate problems.
- Dynamic Pricing / Order Adjustments: Offer “last-minute deals” or reduced pricing on leftover inventory pre-closing time.
- Waste Recognition Systems in Kitchens: AI tools like Winnow use cameras and scales to detect what is wasted; in one pilot, Hilton reduced kitchen waste dramatically.
- Chain-wide Benchmarking & Standardization: For multi-location chains, unify analytics to standardize best practices, track performance across branches.
- Staff Training Feedback Loops: Analytics inform where kitchen staff or servers may need training (e.g., trimming waste, overcooking, plating).
- Real-time Monitoring & Alerts: Dashboards can trigger alerts when waste spikes or thresholds are exceeded.
Because margins in food service are slim, even small reductions in waste can significantly improve profitability.
Best Practices for Implementation
Adopting data-driven waste reduction is not plug-and-play—it requires a thoughtful approach. Below are recommended steps and considerations.
1. Start with a Pilot & Waste Audit
Begin with a pilot unit (a restaurant branch, one kitchen, or one product line). Conduct a waste audit over a set period (e.g. two weeks) to quantify baseline waste by category, cost, location, and reason. Without a baseline, you cannot track improvement.
2. Define Clear Goals & KPIs
Define measurable and realistic targets such as “reduce kitchen trim waste by 20 % in six months” or “save X currency per month in food cost”. Key performance indicators (KPIs) may include:
- Waste weight per unit produced
- Waste cost as percentage of food spend
- Inventory turnover
- Food cost percentage
- Percentage of expired inventory
These KPIs provide clarity and accountability.
3. Choose the Right Tools & Technology
Select systems that match scale and budget. A small operation may begin with spreadsheets or basic POS-integrated modules. Larger operations may adopt integrated food cost analytics platforms plus IoT devices. Favor systems that can integrate seamlessly with your existing POS, inventory, and procurement tools.
4. Automate Data Capture Where Possible
To reduce manual errors and latency, automate waste logging via smart scales, bin sensors, camera systems, or scan-based logging. The less friction in data entry, the more sustainable the system becomes.
5. Integrate Data Silos
Ensure that procurement, inventory, POS, kitchen, and waste systems feed into a central analytics engine or data warehouse. This enables holistic analysis rather than fragmented views.
6. Train Staff & Build a Culture
Staff must understand why waste matters, how to log data accurately, and how to respond to analytics insights. Encourage a culture of continuous improvement, where everyone feels responsible for waste reduction.
7. Monitor, Analyze, Iterate
Regularly review dashboards, detect anomalies or outliers, and drill into root causes. Test interventions (e.g. recipe tweaks, menu removal) and monitor their effect over time. Analytics should inform iterative improvements.
8. Communicate & Incentivize
Share progress internally and externally. Celebrate reductions in waste or cost savings. Align incentives or recognition with waste reduction so staff buy into goals.
9. Scale & Benchmark
Once pilots succeed, scale across operations. Benchmark units against each other, replicate best practices, and set corporate-level targets.
10. Leverage Collaboration & Feedback
Collaborate with suppliers, logistics partners, or even customers. Share forecasts or demand signals so upstream actors can align. For example, if analytics show less demand for a certain ingredient next week, suppliers can adjust offers accordingly.
11. Compliance, Donation & Circular Strategies
Use analytics to support food donation or redistribution (tracking quantities & value), comply with regulatory reporting requirements, and integrate waste-to-compost or energy recovery for non-edible residuals.
12. Regular Review & Update Models
As patterns, consumer behavior, or seasonality change, models and thresholds must be revisited periodically. Maintain and retrain predictive models to stay relevant.
When followed, these best practices enhance the likelihood of success and ensure that data-driven waste reduction becomes sustainable.
Challenges, Risks & Mitigation
No transformation is without obstacles. Below are common challenges and how to mitigate them.
Data Quality & Completeness
- Risk: Missing or erroneous data undermines analysis.
- Mitigation: Enforce validation rules, automate as much as possible, conduct regular data audits, and designate data stewards.
Integration & Legacy Systems
- Risk: Disparate systems may resist integration or require expensive custom interfaces.
- Mitigation: Use middleware, adopt open APIs, use data warehouses or data lakes to bridge systems.
Initial Costs & ROI
- Risk: Investment in sensors, software, training may seem steep upfront.
- Mitigation: Start small (pilot), quantify savings, build a business case. Many businesses see ROI in months.
Scalability & Data Volume
- Risk: Systems may not scale with growing operations; analytics may lag.
- Mitigation: Use cloud infrastructure, scalable databases, and efficient pipelines.
Resistance to Change
- Risk: Staff may resist new workflows or data logging.
- Mitigation: Provide training, incentives, transparency, and leadership support.
Privacy, Security & Vendor Dependence
- Risk: Sensitive data may be compromised; reliance on third-party vendors may lock-in.
- Mitigation: Use secure systems, access controls, encryption, and demand vendor transparency.
Model Accuracy & Bias
- Risk: Predictive models may be inaccurate or biased.
- Mitigation: Regularly validate, retrain, and test models. Monitor performance. Use human oversight for critical decisions.
Unforeseen Externalities
- Risk: Sudden supply chain disruptions, pandemics, or weather anomalies may invalidate models.
- Mitigation: Maintain fallback plans, real-time monitoring, and flexibility in operations.
By anticipating these challenges and proactively designing mitigations, organizations can sustain a data-driven waste-reduction path.
Frequently Asked Questions (FAQs)
Q: At what scale is it worthwhile to use data analytics to reduce food waste?
A: Even small businesses can benefit. A café or small restaurant that tracks waste using simple logs or spreadsheets and correlates that with sales can often uncover inefficiencies. As volume increases, automating data capture and using analytics becomes more valuable.
The tipping point depends on complexity, volume, and waste cost—if food waste is materially affecting your margins, analytics investment is justified.
Q: How soon can cost savings appear?
A: Some pilots report seeing improvements within weeks—adjusting ordering, reducing spoilage, or cutting overproduction. In many cases, return on investment (ROI) can be realized within 6–12 months.
For instance, one study across 114 restaurants showed 26 % waste reduction within a year, with 89 % recouping their analytics investment.
Q: Is AI or machine learning necessary?
A: Not at the start. Descriptive and diagnostic analytics (dashboards, reports) already yield value. AI/ML becomes useful when forecasting demand, detecting anomalies, or recommending adjustments in complex systems. But such models require good data, so analytics maturity must evolve gradually.
Q: How to ensure staff cooperation?
A: Involve staff from the beginning, educate on purpose and benefits, provide simple tools, and set up incentives or recognition aligned with waste reduction goals. Real-time feedback (e.g. dashboard showing waste) helps make improvements tangible.
Q: Can this approach also reduce consumer-side waste (in homes)?
A: Yes. Smart refrigerators, inventory-tracking apps, computer vision for food recognition, expiry prediction, and consumer-facing waste dashboards all help households reduce waste.
For example, a smart fridge system with AI-enabled food detection has been proposed recently to monitor inventory and optimize consumption, thereby reducing waste.
Q: What is the role of food donation or rescue in this framework?
A: Donation or food rescue is part of the waste hierarchy (after source reduction). Analytics can help identify surplus edible food that would otherwise go to waste, document quantities and value for regulatory compliance or tax deduction, and trigger redistribution mechanisms.
Q: Which sectors benefit most?
A: All sectors in the food chain: agriculture, processing, retail, restaurants, catering, institutions (schools, hospitals). Wherever food is produced, stored, sold, or consumed, waste reduction and cost saving opportunities exist.
Q: How to select the right analytics tool?
A: Consider scale, integration capability, modularity, cost, vendor support, and ability to expand. Ideally choose a solution that integrates with your POS, procurement, inventory, and waste measurement systems, with open APIs and flexibility.
Conclusion
The problem of food waste is enormous—in scale, cost, and environmental impact. Yet behind that challenge lies opportunity: using data as a lever to reduce waste, improve efficiency, and cut costs across the food system.
By collecting relevant quantitative and qualitative data, applying analytics (from descriptive to prescriptive), and turning insights into operational changes, organizations can transform guesswork into informed decision-making.
Whether on farms, in factories, at grocery stores, or in restaurants, data-driven strategies enable demand forecasting, waste hotspot detection, recipe optimization, dynamic pricing, truncation reduction, and value recovery.
As businesses adopt these practices responsibly, cost savings accrue, food waste shrinks, and environmental footprints lighten.
Success depends on a strong data foundation, tool integration, staff training, continuous evaluation, and scaling cautiously. Challenges around data quality, legacy systems, change resistance, model drift, and cost must be managed proactively.
But many real-world implementations—from AI cameras in kitchens to shelf-life prediction models—already show dramatic waste reductions and paybacks.
In essence, using data to reduce food waste and cost is not a one-time project; it is a journey. As analytics maturity increases, so does performance: over time, organizations can shift from reactive fixes to proactive prevention.
In doing so, they not only improve profitability but also contribute to global sustainability goals. The future of food management is data-driven—and with it, we can waste less, cost less, and feed more efficiently.