
Cloud analytics is the operating system for modern, multi-location operations. When stores, branches, clinics, or warehouses are scattered across cities or countries, decisions break down without a single, trustworthy view of performance.
Cloud analytics fixes this by centralizing data from every site, standardizing definitions, and pushing insights back to frontline teams. With cloud analytics, multi-location operations can forecast demand, optimize labor, and coordinate inventory while preserving local nuance.
The result is faster decisions, fewer stockouts, tighter cost control, and consistent customer experiences. For multi-location operations, cloud analytics also eliminates brittle, on-prem silos. Data from point-of-sale, ERP, WMS, telematics, staffing, and marketing flows into elastic cloud storage and a lakehouse.
Centralized models then power dashboards, alerts, and predictive workflows. Because the platform runs in the cloud, it scales with seasonal peaks, supports global access, and enforces governance. Cloud analytics reduces the total cost of ownership while improving reliability and speed.
Most importantly, cloud analytics turns data into action. Multi-location operators can roll up KPIs at region or brand level, drill down to a single store, and automate responses such as dynamic pricing or replenishment. With role-based access, each stakeholder sees the right metrics in near-real time.
This article explains how cloud analytics supports multi-location operations end-to-end—architecture, governance, performance, use cases, implementation, and measurement—so you can build a modern, resilient analytics program that actually moves the needle.
Why Cloud Analytics Is a Game-Changer for Multi-Location Operations
Cloud analytics centralizes fragmented data so multi-location operations can align strategy and execution. When every location tracks sales, labor, inventory, and customer feedback differently, leadership cannot compare performance or spot trends.
Cloud platforms standardize schema and business logic, creating a single source of truth for multi-location operations. That shared foundation improves forecasting, budgeting, merchandising, and workforce planning.
Cloud analytics also accelerates decision cycles. Instead of waiting days for batch reports, multi-location operations can monitor live dashboards and trigger alerts within minutes. Regional managers see outliers as they form, not after they spread.
Marketing teams test promotions across clusters and measure lift by store, cohort, or time window. Operations teams adjust labor models dynamically when traffic or conversion shifts. Faster feedback loops reduce waste and improve margins.
Because cloud analytics is elastic, multi-location operations can compute up for month-end close or holiday peaks, then scale down to save cost. Cloud-native services handle security, backups, and high availability, reducing maintenance overhead at every location.
The platform’s global reach supports expansion without new data centers. Finally, integrations with SaaS tools—POS, CRM, HRIS, WMS—simplify the data supply chain. In short, cloud analytics delivers the consistency leadership needs and the agility frontline teams demand.
Centralized Visibility with Local Context
For multi-location operations, “one size fits all” rarely works. Cloud analytics resolves this by blending centralized visibility with local context.
Headquarters defines canonical KPIs—same-store sales, labor-to-sales, shrink, NPS—and enforces consistent calculations across locations. At the same time, teams can segment by climate, footfall pattern, tourist season, or neighborhood demographics to account for local realities.
Cloud analytics lets multi-location operations compare apples to apples while respecting differences that drive performance.
This balance is critical for fair target setting and incentive design. With cloud analytics, regional baselines and peer clusters inform goals. A coastal store with weekend surges should not be judged on the same traffic profile as an airport kiosk.
Multi-location operations can use cloud analytics to cluster locations by product mix, price sensitivity, or service model. Benchmarks then guide coaching, staffing, and assortment choices that fit local demand.
Cloud analytics also closes the loop with location-level action. Store leaders receive role-tailored scorecards, daily action lists, and exception alerts—items to replenish, tasks to audit, promos to feature.
Because data pipelines are automated, frontline teams trust that the numbers match HQ dashboards. This shared context reduces debate, speeds execution, and lifts results. In practice, centralized standards with local autonomy is the winning operating model—and cloud analytics makes it possible at scale.
Core Architecture: From Edge to Lakehouse
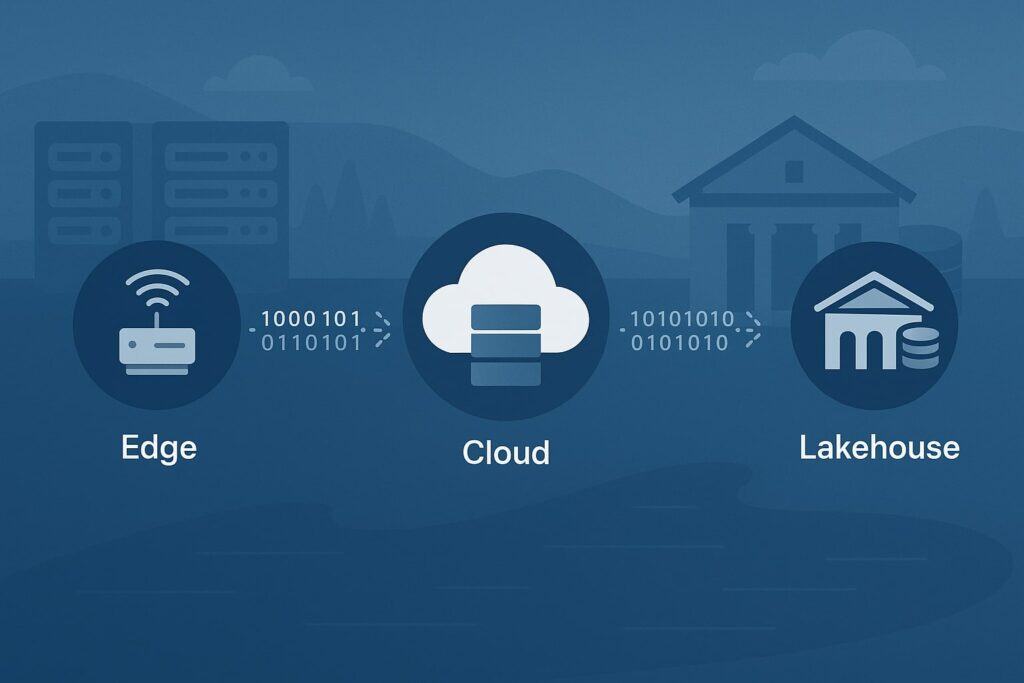
A robust architecture underpins cloud analytics for multi-location operations. Data originates at the edge—POS scanners, kiosks, mobile apps, cameras, sensors, and vehicles. Lightweight connectors stream events to the cloud using secure gateways.
Batch extracts from ERP, HRIS, or legacy systems complement the stream. In the cloud, raw data lands in durable object storage, forming the data lake. A lakehouse layer adds governance, ACID transactions, and table formats that support both BI and ML.
Modern ELT (extract-load-transform) pipelines load source data with minimal alteration, then transform it in-place using SQL or medallion layers (bronze/silver/gold). This pattern is ideal for multi-location operations, where new sources and fields appear frequently.
Schema evolution and data contracts maintain reliability as systems change. Orchestration tools provide dependency graphs, retries, and observability so teams can trace issues to a location or feed quickly.
Serving layers make insights consumable. A semantic model defines business metrics and dimensions once, making “sales,” “traffic,” and “conversions” consistent across tools. BI dashboards expose rollups and drilldowns.
Feature stores serve ML models for demand forecasting, churn prediction, or price elasticity. APIs push insights back into operational systems—replenishment, scheduling, or marketing automation. In short, edge events flow to a governed lakehouse and then out to decision points, creating a closed feedback loop for multi-location operations.
Streaming, Batch, and the Modern ELT
Multi-location operations need both speed and accuracy. Streaming pipelines capture live signals—transactions, clickstreams, telemetry—so cloud analytics can alert teams within minutes.
Batch pipelines reconcile, enrich, and backfill for financial accuracy. The modern ELT stack blends both: micro-batches for freshness, daily jobs for completeness. Orchestrators coordinate dependencies so dashboards remain reliable even as sources change.
For cloud analytics, streaming unlocks use cases like real-time fraud detection, queue length monitoring, and dynamic pricing. Batch remains essential for cost-effective historical analysis, advanced cohorting, and period close.
A practical approach is to stream high-value facts (sales, inventory, labor) at low latency, then run heavier transforms hourly or nightly. This hybrid model gives multi-location operations timely signals without runaway compute costs.
Great ELT also includes data quality. Rules validate volume, schema, and business logic: every sale must have a location; daily totals must reconcile; labor hours must match schedules. Failed checks route to an incident channel with owner, severity, and SLA.
Observability tracks freshness, lineage, and errors by location, helping teams prioritize fixes that affect revenue. With solid streaming, batch, and ELT practices, cloud analytics becomes predictable and trustworthy for multi-location operations.
Governance, Security, and Compliance at Scale

Governance is foundational when cloud analytics spans hundreds of locations. A clear data catalog documents sources, tables, owners, SLAs, and business definitions.
Role-based access control (RBAC) ensures users see only what they need—executives see rollups, store managers see their site, analysts see curated datasets. Attribute-based access control (ABAC) adds location, region, or brand filters dynamically, which is powerful for multi-location operations with complex hierarchies.
Security hardening includes network isolation, encryption at rest and in transit, secrets management, and identity federation with SSO/MFA. Cloud analytics platforms support audit logs and fine-grained permissions for queries, exports, and sharing.
For multi-location operations that process payments or health data, compliance frameworks (PCI DSS, HIPAA, SOC 2, ISO 27001) and regional privacy laws (GDPR, CCPA, state acts) must be reflected in policies and technical controls.
Equally important is governance of the metrics layer. Cloud analytics should define canonical KPIs—gross sales, net sales, comps, basket size, sell-through, OT labor—along with filters and time conventions. Version control and approvals prevent “metric drift.”
That consistency is critical for multi-location operations, where thousands of decisions hinge on the same numbers. With good governance, the organization debates actions, not definitions.
Data Residency, Privacy, and Access Control
Multi-location operations often cross borders, raising data residency questions. Cloud analytics can partition data by region and process PII locally, then publish aggregated metrics centrally. Techniques like tokenization, pseudonymization, and differential privacy minimize risk.
When residency rules restrict raw data movement, federated queries and edge aggregation keep analytics compliant without sacrificing insight.
Access control should mirror operational structure. A store manager sees only their location; a regional lead sees their district; HQ sees all. In cloud analytics, this is enforced via row-level and column-level security, tied to identity groups.
Sensitive fields—card PANs, SSNs, phone numbers—should be masked or excluded from analytic datasets. Data retention policies purge records after legal windows. These controls protect customers and employees while enabling multi-location operations to use cloud analytics safely.
Finally, privacy must be operationalized. Consent tracking, preference centers, and “right to delete” workflows integrate with data pipelines. Audit trails record who accessed which datasets and when.
Security reviews become part of change management so new locations, vendors, or promotions do not introduce gaps. With privacy-by-design, cloud analytics supports multi-location operations without compromising trust.
Performance, Reliability, and Cost Optimization
Performance matters when hundreds of users hit dashboards at 9 a.m. Monday. Cloud analytics improves query speed with partitioning, clustering, materialized views, and result caching. Semantic models push filters and aggregates down to the warehouse efficiently.
BI tools precompute tiles for common slices—yesterday by store, last week by region—so multi-location operations get sub-second interactivity.
Reliability comes from layered SLAs. Pipelines publish freshness and completeness indicators, so users know when data is ready. Blue-green deployments reduce downtime during upgrades. Incident runbooks define triage: roll back, reprocess, or fail open with warnings.
For multi-location operations, reliability also means resilient edge capture. Offline buffers queue transactions if a site loses connectivity, then sync when back online.
Cost optimization (FinOps) is integral. Elastic compute scales down after peaks; auto-suspend idles clusters; storage lifecycle rules tier cold data. Columnar compression reduces scan costs.
Workloads route to the most cost-effective engine—SQL warehouse for BI, object storage for data science. Tagging and budgets track spend by department or location. With cloud analytics, multi-location operations maintain performance while keeping costs predictable.
FinOps for Cloud Analytics
FinOps aligns engineering, finance, and operations to control spending without slowing innovation. For multi-location operations, start with allocation.
Tag resources by business unit, region, and environment (dev/test/prod). Budgets and alerts catch anomalies—sudden spikes in query costs from a runaway dashboard or new location onboarding. Usage reports drive accountability in quarterly reviews.
Optimization tactics include rewriting heavy queries, pruning columns, and adding filters to narrow scans. Materialized views and summary tables serve common use cases at low cost. Right-sizing compute pools and using spot/preemptible instances for non-critical jobs lowers bills.
Storage lifecycle policies move stale logs to cold tiers. Crucially, educate analysts: explain how joins, wildcards, and cross-joins affect costs in cloud analytics. Shared guardrails plus empowerment lets multi-location operations scale insights sustainably.
Finally, measure value, not just cost. Tie spend to business outcomes—reduced stockouts, faster close, improved labor productivity. A transparent cost-to-value narrative secures executive support and focuses teams on the highest-impact analytics work across all locations.
High-Value Use Cases Across Industries
Cloud analytics delivers tangible wins across multi-location operations. In retail and QSR, demand forecasting at SKU-by-store level reduces spoilage and out-of-stocks. Basket analysis optimizes planograms and cross-sell.
Price elasticity models guide markdowns by region, lifting margin. In field services, route optimization lowers fuel and overtime. In healthcare networks, capacity analytics balances appointments, staff, and equipment to cut wait times.
For logistics hubs and warehouses, cloud analytics improves slotting, pick paths, and dock scheduling based on live volume and historical patterns. In banking branches, cloud analytics aligns staffing with transaction profiles and steers product offers based on local demographics.
In hospitality, reputation analytics aggregates reviews and social sentiment to direct service recovery and menu changes. Across industries, the pattern repeats: centralize data, model local demand, push actionable insights back to each site.
Multi-location operations can also use cloud analytics to monitor compliance and brand standards. Computer vision audits planogram compliance or cleanliness. IoT sensors track temperature for food safety.
Mystery shopping and NPS combine with sales metrics to flag locations needing coaching. By connecting diverse signals, cloud analytics helps multi-location operations deliver consistent experiences at scale.
Retail & Hospitality: From Forecasts to Frontline Actions
Consider a restaurant group with hundreds of locations. Cloud analytics ingests POS tickets, labor schedules, deliveries, weather, events, and third-party delivery data. A demand model predicts covers by 15-minute intervals and suggests staffing and prep plans.
Managers receive a daily briefing: expected rush windows, items to prep early, and promotions to feature. When actual traffic deviates, a mobile alert recommends adding a runner or pausing a low-margin offer. This is cloud analytics turning insights into frontline actions across multi-location operations.
In retail, a fashion chain combines sell-through, returns, and footfall to optimize allocation. Cloud analytics flags stores with stalled sizes and proposes transfers before markdowns. Visual merchandising teams A/B test displays and measure conversion lift by store cluster.
Marketing runs geo-targeted campaigns and reads incrementality using holdout locations. Because all of this runs on a governed, elastic platform, initiatives scale from pilot to network quickly.
Hospitality adds guest experience. Cloud analytics consolidates reviews, surveys, and service tickets to find friction points. A regional dashboard highlights menu items driving complaints, rooms with repeated maintenance issues, or locations with slow fulfillment.
Training and maintenance work orders are triggered automatically. The feedback loop shortens, and multi-location operations build habit-forming quality improvements.
Implementation Roadmap for Multi-Location Operators
Successful programs start with business outcomes, not tools. Define 3–5 needle-moving goals: reduce stockouts, cut overtime, shrink waste, raise NPS. Align executive sponsors and location leaders. Inventory data sources and map ownership.
Select a cloud analytics platform that fits existing skills and compliance needs. Create a reference architecture and security baseline before building dashboards.
Phase work into value-based waves. Wave 1: foundation (ingest POS and inventory, define core KPIs, ship executive and region dashboards). Wave 2: frontline enablement (store/branch scorecards, alerting, mobile access, data quality SLAs). Wave 3: optimization (forecasting, labor optimization, price/promotions, transfer recommendations).
Each wave should include training and change management so locations adopt the tools. Document playbooks: how managers use daily briefings, how analysts publish certified datasets, how engineers handle incidents.
Finally, treat cloud analytics as a product. Maintain a backlog, publish a roadmap, collect feedback from location users, and iterate. Establish a data governance council that includes operations and finance.
Measure adoption: daily active users, dashboard latency, alert engagement, and the percent of decisions backed by data. For multi-location operations, the program’s success is measured in behavior change on the floor, not just pretty charts.
Change Management and Enablement
Technology succeeds only when people use it. For multi-location operations, invest early in enablement. Start with role-based journeys: store manager, regional lead, merchandiser, labor planner, finance partner.
For each role, craft simple workflows in the cloud analytics portal: morning read-out, midday checks, end-of-day reconciliation. Create short videos and one-pagers with screenshots of the exact dashboards they’ll use.
Pilots are critical. Choose diverse locations—high volume, low volume, urban, suburban—to surface edge cases. Run pilots for a full cycle (promo, payday, weekend). Hold weekly feedback sessions and fix friction fast.
Recognize managers who adopt the new processes and share their results widely. Tie incentives to usage where appropriate.
Support matters post-launch. Offer office hours, a community channel, and a searchable knowledge base. Embed data champions in each region who can coach peers. Align leadership communications so directors and VPs ask for the same KPIs that frontline teams see.
When cloud analytics and multi-location operations speak the same language, adoption sticks and value compounds.
Measurement and Continuous Improvement
You can’t improve what you don’t measure. Establish a measurement framework that links cloud analytics initiatives to operational and financial outcomes. Track leading indicators (dashboard adoption, data freshness, alert resolution time) and lagging results (stockouts, waste, overtime, NPS, margin).
For multi-location operations, segment results by region, cluster, and store maturity to identify where playbooks work and where they need tuning.
Run controlled experiments whenever feasible. Use holdout locations to estimate incremental impact of a pricing change or a new schedule optimization model. Publish experiment results transparently and fold learnings into updated playbooks.
Maintain a KPI catalog that documents definitions, owners, and calculation logic. This prevents drift and builds trust in cloud analytics outputs across multi-location operations.
Finally, plan quarterly reviews. Revisit the roadmap, reassess data quality, and retire unused dashboards. Compare spend versus value and reallocate budget to the highest-return use cases. Continuous improvement turns cloud analytics into a durable advantage for multi-location operations, not a one-off project.
KPI Catalog and Benchmarking
A KPI catalog is the backbone of consistent measurement. List each metric—definition, grain, filters, owner, refresh cadence, and intended decisions.
Examples for multi-location operations include: same-store sales, traffic, conversion, average ticket, sell-through, weeks of supply, on-time delivery, waste %, OT hours %, labor-to-sales, NPS, complaint rate, and first-contact resolution. Include formulas and sample queries so analysts implement metrics the same way across tools.
Benchmarking turns metrics into targets. Cloud analytics can cluster locations by demand patterns and compare performance to peers. Publish percentile bands for key KPIs and use them in scorecards.
Encourage locations to set specific, time-bound improvement goals—“move labor-to-sales from 15.5% to 14.8% in eight weeks.” Combine benchmark data with qualitative insights from regional visits to identify practical changes. Over time, the catalog and benchmarks create a common language that aligns every level of multi-location operations.
FAQs
Q.1: How do we choose the right cloud analytics platform for multi-location operations?
Answer: Start with requirements, not features. List regulatory constraints, data volumes, real-time needs, and existing skills. For multi-location operations, prioritize elasticity, strong RBAC/ABAC, row-level security, and robust connectors for POS, ERP, WMS, HRIS, CRM, and marketing tools.
Ensure the platform supports a lakehouse architecture so both BI and ML run on the same governed data. Validate support for medallion layers, semantic models, and open table formats to avoid lock-in.
Evaluate cost transparency: storage tiers, compute scaling, caching, and workload isolation. Test real workloads with a pilot—ingest from a few locations, build a KPI model, and roll out a daily briefing. Measure latency, adoption, and cost.
Finally, assess the vendor ecosystem and community strength. The “right” cloud analytics choice is the one your teams can operate confidently while supporting your multi-location operations roadmap for at least the next 3–5 years.
Q.2: How can cloud analytics help with staffing and labor optimization across locations?
Answer: Cloud analytics blends historical sales, traffic, reservations, appointments, and local events to forecast labor needs by interval and by location. For multi-location operations, models account for seasonality, weather, pay cycles, and promotions.
Output becomes an actionable staffing plan: recommended headcount per role per 15–30 minute block. Real-time signals—POS velocity, queue length, mobile orders—trigger alerts when reality deviates from plan, guiding managers to call in help or reassign tasks.
Dashboards track labor-to-sales, OT hours, schedule adherence, and productivity by location. Over time, multi-location operations use cloud analytics to reduce overtime, improve service levels, and increase employee satisfaction through more predictable schedules.
Integrations with workforce management systems close the loop so schedules update automatically when demand shifts.
Q.3: What’s the best way to manage data quality for multi-location operations?
Answer: Treat data quality as a product with owners and SLAs. Implement layered tests—schema, volume, and business rules—at ingestion and transformation stages. For multi-location operations, rules should validate location keys, reconcile daily totals, and flag anomalies in returns, discounts, or voids.
Equip pipelines with observability: freshness, row counts, failure rates, and lineage. When checks fail, route incidents to the right owner with severity and expected fix times. Publish a status page so users know when data is trustworthy. Use data contracts with upstream systems to define payloads and change processes.
Finally, invest in proactive improvement: backfill missing fields, standardize codes, and retire redundant feeds. Reliable data builds trust, and trust drives adoption of cloud analytics across multi-location operations.
Conclusion
Cloud analytics is the control tower for multi-location operations. It unifies data, standardizes metrics, and pushes timely insights to every level—from headquarters to the frontline.
With a modern architecture, strong governance, and disciplined FinOps, organizations gain speed and consistency without runaway cost. The payoff shows up in fewer stockouts, smarter labor, better customer experiences, and higher margin—at every location.
Success comes from focusing on outcomes, not just tooling. Start with a few high-impact use cases, deliver value fast, and scale with clear playbooks. Build a KPI catalog, measure adoption, and run experiments to prove impact.
Above all, remember the operating model: centralized standards plus local autonomy. When you pair that model with cloud analytics, multi-location operations become simpler to manage, faster to adapt, and far more resilient in any market.