
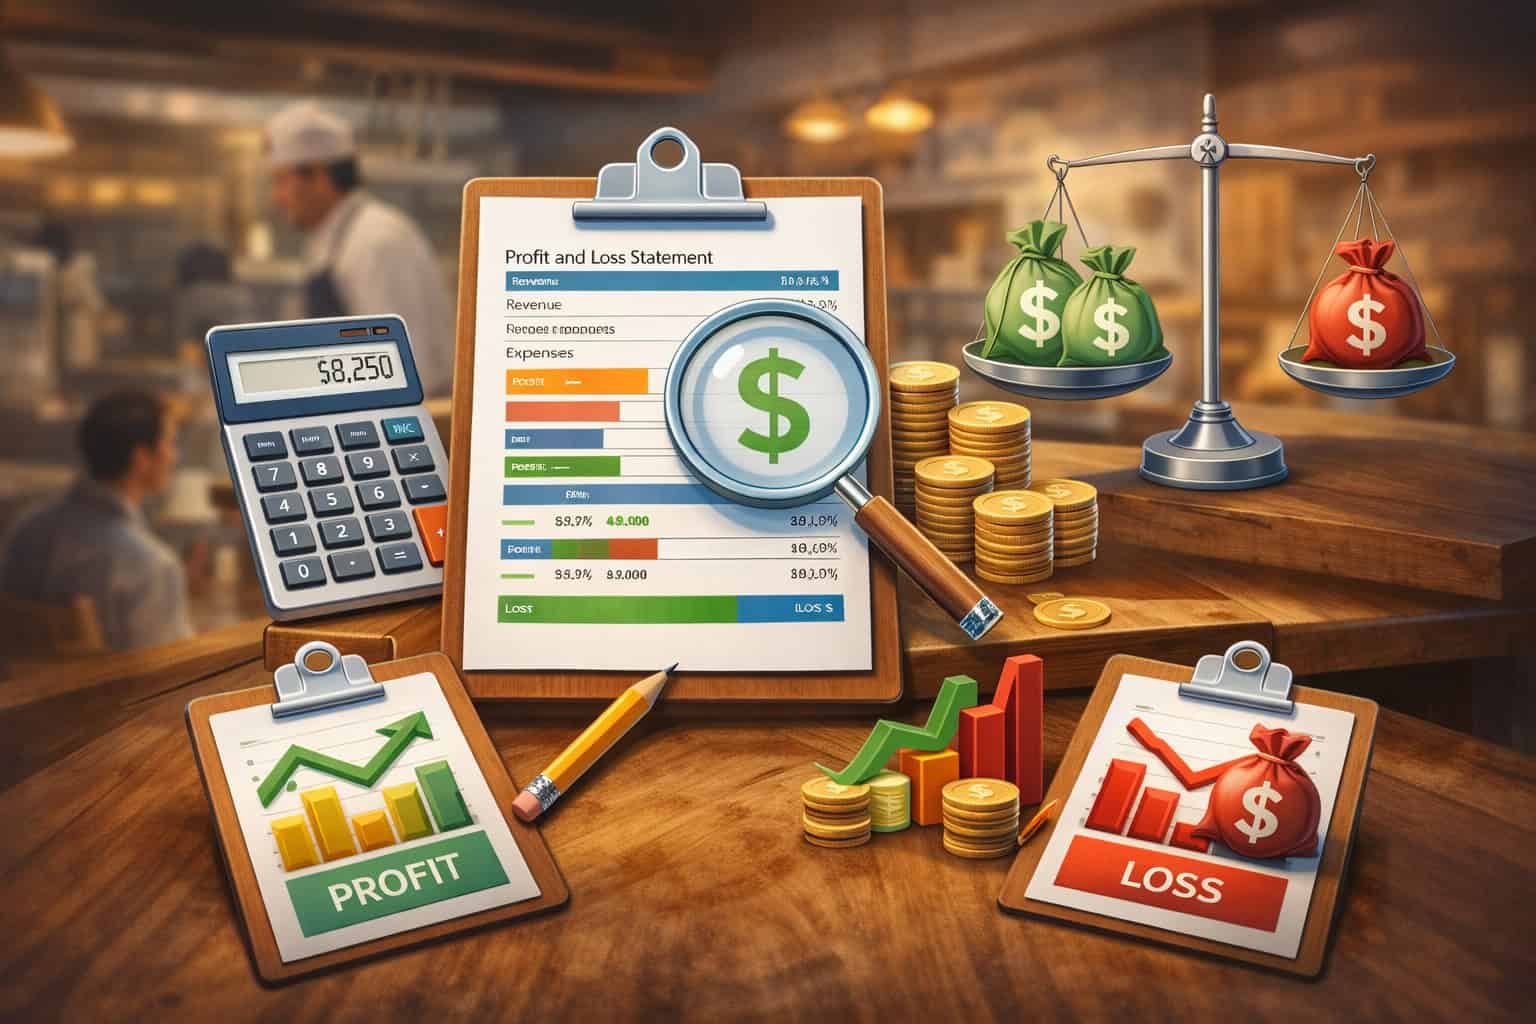
Running a restaurant is part craft, part leadership, and part math. The math doesn’t have to be intimidating—but it does need to be consistent. A restaurant profit and loss statement (P&L) is the simplest, most powerful tool you have to understand where the money is coming from, where it’s going, and what to change next.
If you’ve ever looked at your numbers and thought, “Sales were strong—so why didn’t we feel it?” This guide is for you.
You’ll learn how to read a restaurant P&L statement step-by-step, what each line item actually means, and how to turn analyzing restaurant profit and loss reports into clear, practical decisions about menu, labor, purchasing, and operations.
This is a restaurant financial statement breakdown written for owners, operators, and general managers who want clarity—not accounting jargon. (Educational content only, not financial advice.)
What a restaurant profit and loss statement is (and what it’s not)
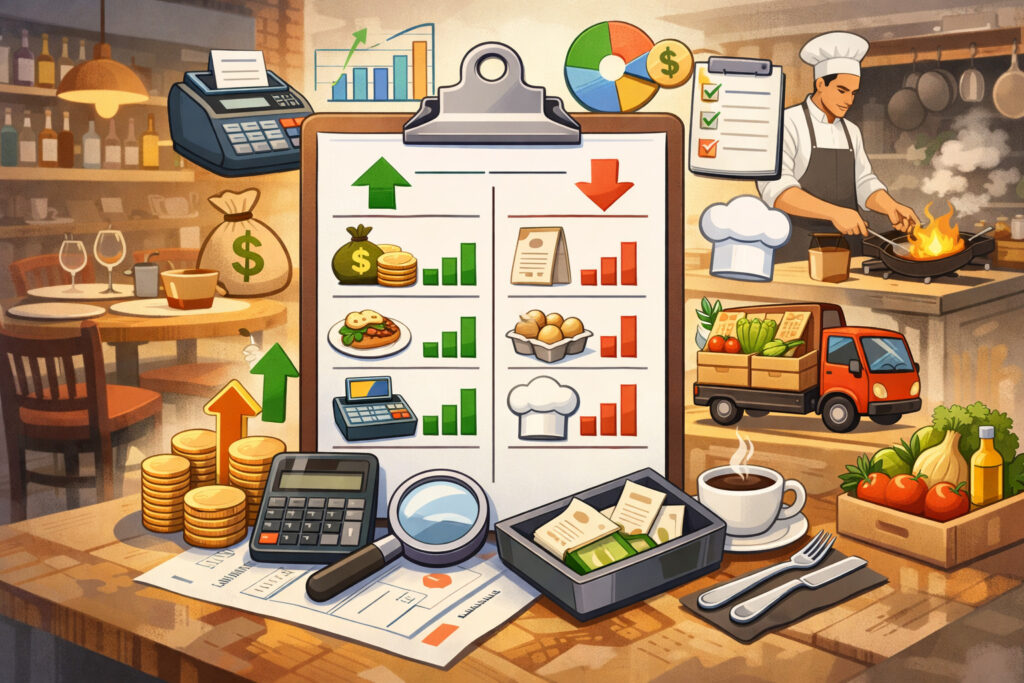
A restaurant P&L—also called an income statement for restaurants—summarizes your revenue and expenses over a specific period (usually a month) and shows whether you operated at a profit or loss for that period.
Think of it as your restaurant’s “story” in numbers: what you sold, what it cost to produce those sales, what it cost to run the operation, and what’s left at the end.
The P&L answers questions like:
- Are we making money on our core business (before financing and taxes)?
- Which expense categories are growing faster than sales?
- Is labor being deployed efficiently for our sales volume?
- Are food cost percentage and waste improving or slipping?
- Is our net operating profit increasing as we scale?
What it’s not: your P&L is not a bank balance, and it’s not a cash flow statement. That’s where many restaurants get tripped up – especially with delivery marketplaces, processor deposits, tip outs, and subscription-style software fees.
You can show a profit on the P&L and still be short on cash, because cash timing is separate from profit timing.
Pro Tip: Treat your P&L like a dashboard, not a grade. The goal isn’t to “look good” on paper—it’s to spot what’s changing early enough to act.
A strong P&L process also depends on consistency: consistent category mapping from POS to accounting, a clean chart of accounts for restaurants, and the habit of reviewing percentages (not just dollars). Dollars tell you “how much.” Percentages tell you “how well.”
The basic structure of a restaurant P&L (the big picture)
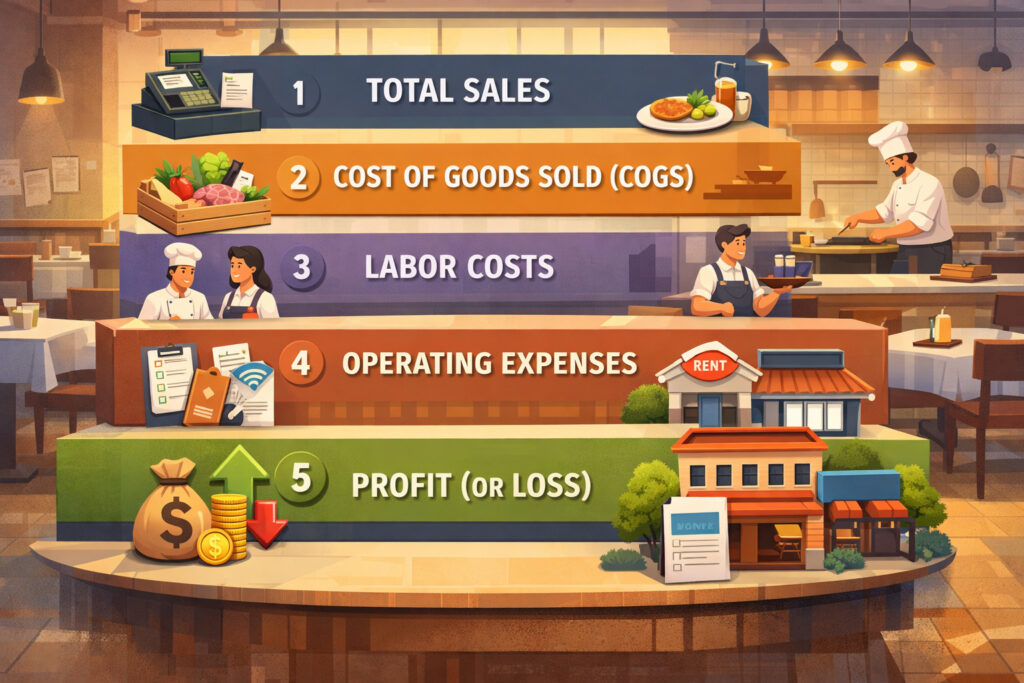
Most restaurant P&Ls follow a predictable structure, even if the category names differ. Learning the flow is the quickest way to become confident:
- Sales / Revenue
- Cost of Goods Sold (COGS)
- Gross Profit
- Labor
- Operating Expenses (OpEx)
- Occupancy Costs
- Net Operating Profit (sometimes followed by “other income/expense”)
Each section builds on the one above it. When you read top to bottom, you’re basically asking: “Did we sell enough? Did it cost too much to produce? Did we staff smartly? Did overhead creep up? What’s left?”
A useful way to simplify:
- Gross Profit tells you if the kitchen/bar economics work.
- Prime cost (food + labor) tells you if the operation is controlled.
- Operating expenses (OpEx) tell you if the business model fits your volume.
- Net operating profit tells you what the restaurant generated before financing and taxes.
You’ll also see versions that include:
- Sales by category (food, beverage, delivery, catering, retail)
- Contribution margin lines for channels (dine-in vs delivery)
- “House profit” vs “restaurant-level profit” groupings
These are helpful, but only if the underlying data is mapped correctly. If sales categories are messy or delivery fees are misclassified, the P&L becomes hard to trust.
Pro Tip: If you can’t explain a line item, it’s a signal that the chart of accounts needs cleanup—or the bookkeeping is lumping too much together.
Revenue: how sales are recorded (and why the sales mix matters)
Revenue is more than “total sales.” For decision-making, you want sales broken into categories that match how you operate. That’s where sales by category (food, beverage, delivery) becomes the foundation of good analysis.
Typical categories include:
- Food sales (often split further into entrée/app/dessert if you track it)
- Beverage sales (NA beverages, beer, wine, spirits)
- Delivery marketplace sales vs in-house delivery
- Catering / events
- Merchandise or retail items (if applicable)
Why it matters: the same total sales can produce very different profit outcomes depending on mix. Beverage often carries different margin dynamics than food. Delivery channels include fees and packaging costs that can change contribution margin even when the ticket looks “higher.”
You’ll also want to watch:
- Comping and discounts impact (promos, manager comps, loyalty, coupons)
- Voids and refunds (and whether they are tracked cleanly)
- Gift card redemptions vs gift card sales (more on this later)
A revenue section should ideally show:
- Gross sales
- Less: comps/discounts (tracked as reductions to revenue)
- Net sales (what you actually earned before costs)
Pro Tip: Make sure discounts are not silently being “absorbed” into COGS or OpEx. If comps are hiding in the wrong section, your margins lie to you.
For 2026 operations, also confirm how online ordering platforms record sales: some send gross sales and separate fees; others deposit net amounts. If accounting records deposits as sales without capturing fees correctly, you’ll think revenue dropped when it didn’t—or you’ll miss fee creep.
Cost of Goods Sold (COGS): what it includes and how to keep it honest
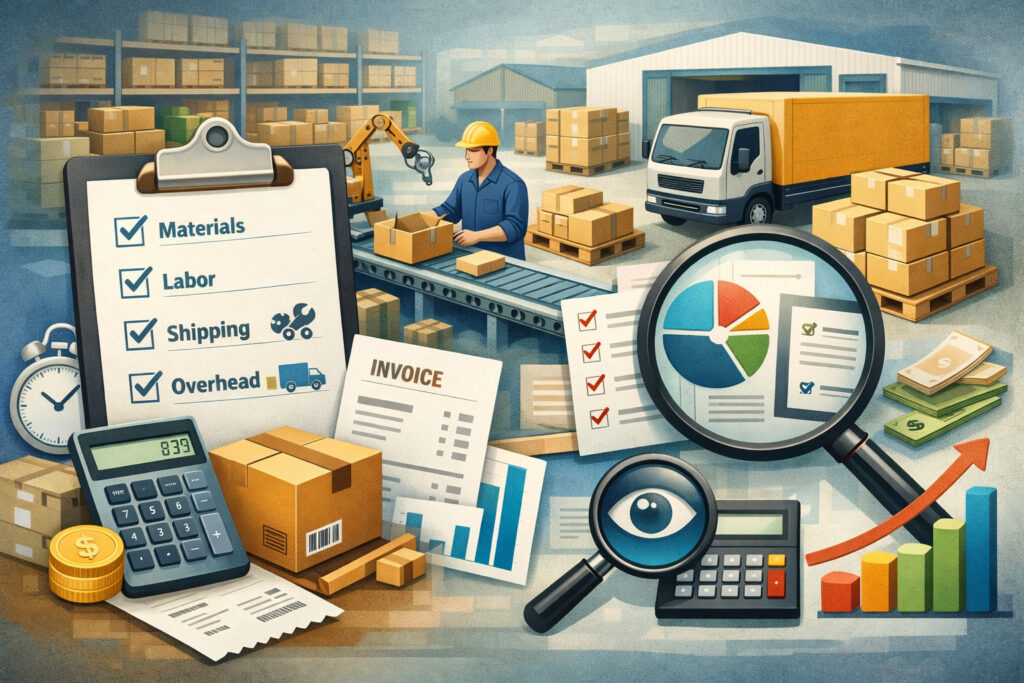
Cost of goods sold (COGS) is the cost of the products you sell—primarily food and beverage. On a restaurant P&L, COGS is where you see whether purchasing, portioning, waste control, and inventory discipline are working.
A common structure:
- Beginning inventory
- Purchases
- Ending inventory
- = COGS
That formula matters because it separates “buying” from “using.” If you buy heavy at month-end but haven’t used the product yet, purchases rise but COGS shouldn’t—if inventory is counted and recorded correctly.
COGS typically includes:
- Food purchases (proteins, produce, dry goods, dairy)
- Beverage purchases (beer/wine/spirits, mixers, NA beverages)
- Paper and packaging (some restaurants include this in COGS; others in OpEx)
- Condiments and smallwares (depends on your accounting policy)
COGS is where operational reality hits accounting. If your inventory counts are inconsistent, or you don’t record vendor credits properly, your food cost percentage can swing without a real change in performance.
Pro Tip: If COGS is volatile month-to-month, verify (1) inventory counts timing, (2) vendor invoice cutoff, and (3) credits/returns posted in the right month.
Also consider waste and theft. Waste shows up as higher COGS, but you’ll only find the “why” through operational tracking:
- Prep waste, spoilage, overproduction
- Portioning drift (especially proteins and high-cost items)
- Comped meals not recorded as comps (becoming “mystery COGS”)
- Unpriced staff meals or inconsistent meal policies
If you want better control, tighten the chain: purchase → receiving → storage → prep → portion → sale. COGS is the score, but the game is played on the line.
Gross profit vs net profit: what the middle of the P&L is telling you
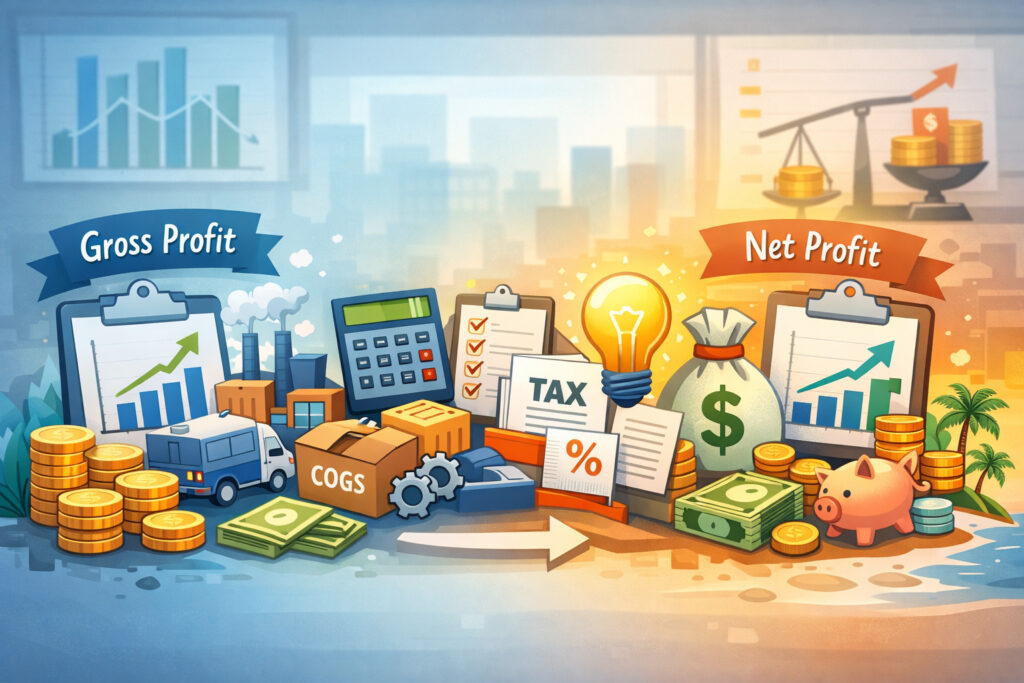
This is where many operators gain confidence fast: understanding the difference between gross profit vs net profit.
Gross profit: your product economics
Gross profit = Sales – COGS: It shows what’s left after paying for the products you sell. Gross profit can also be expressed as gross margin:
Gross Margin = (Sales – COGS) / Sales: Gross profit answers: “Are we pricing and portioning correctly?” If gross margin is shrinking, something is happening in:
- Menu pricing strategy
- Portion control and waste
- Vendor cost increases
- Sales mix (more low-margin items)
Net operating profit: your restaurant’s operating result
After gross profit, you subtract labor and operating expenses. What’s left is often called net operating profit or operating income. This shows how well the restaurant runs as a business, not just how well it buys and sells food.
Be careful with terminology: some P&Ls include owner salary, some don’t. Some include interest and taxes below operating profit. That’s why comparing “net profit” across restaurants can be misleading unless the structure is consistent.
Pro Tip: When comparing periods, focus first on: gross margin %, labor %, prime cost %, and controllable OpEx %. These are more comparable and actionable than net profit dollars alone.
Gross profit is necessary but not sufficient. You can have a strong gross margin and still struggle if labor scheduling is loose or occupancy costs are out of proportion to your volume. The P&L helps you see which lever matters most right now.
Labor: beyond the percentage (and how scheduling shows up on the P&L)
Labor is usually the biggest controllable cost after COGS, and it’s where operational discipline has the fastest payoff. On the P&L, labor may be grouped as:
- Front-of-house wages
- Back-of-house wages
- Management salaries
- Payroll taxes and employer contributions
- Benefits
- (Sometimes) contracted labor
Labor Cost % = Labor / Total Sales
The percentage is useful, but only if you read it in context:
- A “good” labor percentage depends on service model, hours, and sales mix.
- Early in the month or during season shifts, labor may look worse even if you’re staffing correctly.
- Overtime, training hours, and turnover costs can inflate labor even when scheduling is “tight.”
To turn labor numbers into decisions, pair the P&L with operational reports:
- Labor hours by daypart
- Sales per labor hour (SPLH)
- Guests per labor hour (if you track covers)
- Overtime and premium pay
- Manager schedule vs floor coverage
Pro Tip: If labor % spikes, ask: “Did sales drop, did hours rise, or did wages change?” The fix depends on which one moved.
Also confirm what your P&L includes. In 2026, tip credits, service charges, and tip pooling can complicate reporting. Make sure you know whether “labor” includes:
- Only employer-paid wages
- Employer payroll taxes
- Allocated or reported tips (usually not an employer expense, but can appear in reports)
- Service charge distributions (often treated differently than tips)
A clean labor section supports better scheduling, clearer performance coaching, and better forecasting—especially when you review weekly.
Prime cost: why it’s the first margin you should manage
Prime cost (food + labor) is the combined total of your two biggest, most controllable costs: COGS and labor. It’s the cornerstone of restaurant financial management because it tells you whether your core operations are under control.
Prime Cost % = (COGS + Labor) / Total Sales
Why prime cost is powerful:
- It’s hard to “hide” operational issues when you look at the combined number.
- It accounts for tradeoffs (e.g., spending a bit more on labor to reduce waste).
- It makes budgeting and staffing decisions easier to frame.
Prime cost is also the bridge between the kitchen and the floor. Food cost is driven by portioning, waste, pricing, and purchasing. Labor is driven by forecasting, scheduling, training, and service model. Prime cost forces a unified view.
That said, prime cost is not a magic target you hit once and ignore. It changes based on:
- Concept type and service style
- Hours of operation
- Volume and seasonality
- Delivery mix and packaging costs
- Pricing strategy and promotions
Use ranges, not absolutes. Here are practical ranges many operators use for planning and benchmarking—not as guarantees.
Table 1: Prime cost target ranges by restaurant type (use for planning)
| Restaurant Type | Typical Prime Cost % Range | Notes on Why It Varies |
|---|---|---|
| Quick service / counter service | 50%–65% | Higher volume can lower labor %, but packaging and promos can push COGS up. |
| Fast casual | 55%–70% | Labor efficiency depends on throughput and menu complexity. |
| Casual dine-in | 60%–75% | Service labor and broader menu can increase both COGS and labor. |
| Upscale / fine dining | 65%–85% | Higher staffing ratios and premium ingredients are common; pricing discipline is critical. |
| Bar-forward concept | 50%–70% | Beverage mix can improve margin, but labor and late hours can increase costs. |
| Delivery-heavy operation | 60%–80% | Packaging, comps/refunds, and channel fees can pressure contribution margin. |
Pro Tip: If prime cost is high, don’t automatically cut labor. First verify whether portioning, waste, or discounting is inflating COGS. Cutting labor without fixing waste often hurts guest experience and sales.
Prime cost is the earliest “profit signal” on your P&L. Manage it weekly, review it monthly, and use it to align your leaders.
Operating expenses: controllable vs fixed (and why OpEx creeps quietly)
After COGS and labor, you’ll see operating expenses (OpEx). This includes the costs to run the restaurant that aren’t directly tied to ingredients or payroll.
Common OpEx categories:
- Supplies (paper, cleaning, smallwares)
- Repairs and maintenance
- Marketing and promotions
- Software subscriptions (POS, scheduling, reservations, accounting integrations)
- Merchant processing fees
- Professional fees (legal, accounting)
- Licenses and permits
- Insurance
- Bank fees
- Uniforms and linen
- Training, recruiting, background checks
OpEx is where “small” recurring expenses pile up. In 2026, software stacks can grow quickly: online ordering, loyalty, inventory, labor tools, analytics add-ons, delivery dispatch, guest Wi-Fi, cameras, payroll, HR. Each may be justified—but together they can silently compress margins.
A helpful way to review OpEx is fixed vs variable costs:
- Variable costs change with sales volume (card processing fees, some supplies, delivery packaging).
- Fixed costs stay relatively stable (certain software, some insurance, many contracted services).
Most OpEx includes a mix. Repairs are “lumpy.” Marketing may be discretionary. Utilities can swing seasonally. The job is to separate “normal fluctuation” from “creep.”
Pro Tip: If OpEx is rising, check for new subscriptions, rate increases, and “set-and-forget” vendor contracts. Small monthly charges can become large annual leaks.
When you read your P&L, avoid the trap of only looking for one big issue. Many restaurants improve margins by tightening five or six medium categories, not one dramatic cut.
Occupancy costs: rent, CAM, utilities—and the reality check they provide
Occupancy costs (rent, CAM, utilities) can make or break the economics of a location, especially when sales shift. Occupancy is often less controllable month-to-month, but it’s critical to monitor because it sets the baseline your operation must cover.
Occupancy costs may include:
- Base rent
- Common area maintenance (CAM)
- Property taxes (if passed through)
- Insurance (if passed through)
- Utilities (electric, gas, water)
- Trash and grease services (sometimes listed in OpEx)
- Security (if contracted)
Unlike food and labor, you can’t “schedule” your way out of occupancy. That’s why occupancy is a powerful reality check: if your rent is high relative to achievable sales, you’ll feel constant pressure—even if operations are solid.
How to think about occupancy:
- As sales rise, occupancy becomes a smaller percentage.
- When sales fall, occupancy becomes a larger percentage quickly.
- Utility spikes can indicate equipment issues (leaks, failing refrigeration, HVAC problems).
Pro Tip: Track utilities monthly and compare year-over-year. Sudden increases often have operational causes you can fix (maintenance, usage patterns), not just rate changes.
Occupancy also affects strategic decisions:
- Hours of operation: are you open long enough to leverage the fixed cost?
- Seating and throughput: are you maximizing revenue per seat per hour?
- Channel mix: does delivery increase sales enough to cover added fees and packaging while still helping occupancy leverage?
Even though you can’t renegotiate rent every month, you can make smart decisions about volume, pricing, and operating model that improve how occupancy fits your concept.
EBITDA: a high-level profitability lens (and when it helps)
You’ll sometimes see EBITDA referenced in restaurant discussions, lender conversations, or when comparing multi-unit performance. EBITDA stands for:
Earnings Before Interest, Taxes, Depreciation, and Amortization
EBITDA is a way to approximate operating profitability before financing costs, taxes, and certain non-cash expenses (like depreciation). It can be useful when:
- Comparing two restaurants with different financing structures
- Evaluating profitability “before debt”
- Looking at the performance of a unit independent of ownership decisions
But EBITDA is not “cash,” and it’s not a replacement for understanding your P&L. It’s a summary metric that sits above the detail.
Where restaurant teams go wrong is using EBITDA like a trophy metric without verifying the inputs. If delivery marketplace fees are misclassified, or comps are hidden, EBITDA won’t tell you that—your line-item review will.
Pro Tip: Use EBITDA as a high-level lens, but manage the business through prime cost, sales mix, and controllable OpEx.
For many operators, the best approach is: get your P&L accurate and consistent first, then consider EBITDA as one of several profitability views.
A restaurant financial statement breakdown: P&L line items explained (and how to improve them)
A clear line-item understanding turns your P&L from “paperwork” into an operating tool. Here’s a practical breakdown of common P&L categories, why they matter, and what to do when they’re off.
Table 2: P&L line items explained (what it is, why it matters, how to improve)
| P&L Line Item | What It Is | Why It Matters | How to Improve (Practical Moves) |
|---|---|---|---|
| Net Sales | Sales after comps/discounts/refunds | The base your percentages are built on | Clean POS category mapping; track discounts consistently; reduce unplanned comps. |
| Food COGS | Cost of food used in the period | Drives food cost percentage and gross margin | Tight portioning; adjust pricing; reduce waste; improve inventory accuracy. |
| Beverage COGS | Cost of beverages used | Strong driver of margin in many concepts | Pour controls; standard recipes; monitor promotions; train bartenders on specs. |
| Gross Profit | Net Sales minus total COGS | Shows product economics | Fix pricing, portioning, and sales mix; address high-cost items. |
| Hourly Labor | Non-salaried wages | Flexible lever tied to forecasting | Schedule to sales; manage breaks; reduce overtime; cross-train. |
| Salaried Labor | Managers/chefs salary | Stability + leadership cost | Right-size roles; clarify responsibilities; align schedules with peak demand. |
| Payroll Taxes/Benefits | Employer costs tied to wages | Often overlooked in labor planning | Budget with fully-loaded labor; audit payroll setup; manage turnover. |
| Prime Cost | COGS + total labor | Best snapshot of operational control | Attack waste + scheduling together; set weekly targets; coach managers. |
| Operating Supplies | Paper, cleaning, smallwares | Quiet margin leak over time | Standardize ordering; set pars; audit usage; train on waste reduction. |
| Repairs & Maintenance | Fixes, service calls | Can spike and distort months | Preventive maintenance plan; log issues; replace chronic failure items. |
| Marketing | Ads, promos, events | Should connect to measurable sales | Track ROI by channel; plan promos; avoid constant discounting. |
| Software/Subscriptions | POS and add-ons | Stacking tools can compress margin | Quarterly stack review; remove unused tools; negotiate terms. |
| Merchant Fees | Card processing costs | Directly tied to payment mix/fees | Monitor effective rate; reduce keyed entries; optimize surcharge/service fee strategy (if used). |
| Occupancy Costs | Rent, CAM, utilities | Sets baseline needed to win | Improve throughput; optimize hours; monitor utilities; renegotiate where possible. |
| Net Operating Profit | Profit after operating costs | The restaurant’s core result | Improve sales mix, prime cost, and OpEx discipline; review monthly. |
Pro Tip: If a line item is “miscellaneous” and growing, break it into real categories. “Misc” is where leaks hide.
This table is most useful when paired with a monthly variance review: what changed, why it changed, and what you’ll do next month.
A sample simplified restaurant P&L (text-based example)
Below is a simplified example to show the flow. Your actual P&L may include more detail, but the structure is similar.
This example shows something important: strong gross margin can still result in a loss if labor, OpEx, or occupancy are too high for the volume.
Pro Tip: When you see an operating loss, don’t panic. Use the P&L to identify whether the primary issue is volume, prime cost control, or overhead structure.
How to read a restaurant P&L statement step-by-step (the operator’s method)
This is the practical flow I’d teach a GM: read your P&L the same way every month, in the same order, and ask the same questions. Consistency turns confusion into pattern recognition.
Step 1: Start with sales mix (not total sales)
Before you analyze costs, understand what you sold.
- Did food vs beverage mix change?
- Did delivery become a larger share?
- Did catering spike (and was it profitable)?
- Did discounts and comps increase?
This matters because each channel has different economics. Delivery, for example, often has lower contribution margin due to marketplace fees and packaging. If delivery grew, it may explain a margin dip—even if “sales are up.”
Pro Tip: Track net sales by channel and compare it to the same month last year. The goal is to separate seasonality from operational issues.
Step 2: Review COGS and waste signals
Now look at COGS as a percentage of the relevant sales category (food vs beverage). If your P&L allows it, calculate:
- Food cost percentage
- Beverage cost percentage
Then look for waste signals:
- High-cost items moving faster than expected
- Purchases rising without corresponding sales
- Inventory counts inconsistent or missing
- Credits/returns not recorded
Step 3: Analyze labor and scheduling effectiveness
Next, look at labor in total and by component:
- Hourly wages
- Salaried management
- Payroll taxes/benefits
Ask:
- Did labor hours match sales volume?
- Did we overschedule slow dayparts?
- Did overtime increase?
- Did turnover/training hours spike?
Step 4: Examine prime cost as your control number
Prime cost tells you whether your operation is controlled enough to generate profit. If prime cost increased, determine whether it’s driven by COGS, labor, or both—and then match the fix to the driver.
Step 5: Review controllable vs fixed expenses
Finally, scan OpEx and occupancy:
- Controllable OpEx: supplies, repairs, marketing, subscriptions, fees
- More fixed: rent, many contracted costs, some software
Look for “creep” (slow upward drift) and “spikes” (one-time issues). Both matter, but they require different action plans.
Pro Tip: If your P&L feels overwhelming, circle the top 5 variances vs last month, and work only those. You’ll get better results than trying to “fix everything.”
Key restaurant metrics and formulas (plain language, plain text)
Metrics are only helpful if they lead to action. Here are the core formulas you’ll see (and should be able to calculate quickly).
Food Cost % and why you should calculate it by category
Food Cost % = COGS / Food Sales
You want to compare food COGS to food sales, not total sales, because beverage and other channels can distort the view. Food cost percentage is sensitive to:
- Portioning and recipe consistency
- Waste/spoilage
- Vendor prices and ordering practices
- Sales mix (selling more of your high-cost items)
Pro Tip: If food cost % moves, check if it’s a true operational change or a category mapping issue (e.g., some food sales being recorded under “other”).
Labor % and what it can’t tell you alone
Labor % = Labor / Total Sales
Labor % can worsen because sales fell, even if labor hours stayed disciplined. That’s why labor must be reviewed with scheduling metrics (sales per labor hour) and staffing decisions.
Prime Cost % as your “control” metric
Prime Cost % = (COGS + Labor) / Total Sales
Prime cost is the most useful “single number” for operational discipline. It’s where kitchen and FOH performance meet.
Gross margin as your pricing + purchasing signal
Gross Margin = (Sales – COGS) / Sales
Gross margin moving down usually points to pricing lag, vendor cost increases, or portion/waste issues.
Break-even point basics (simple explanation)
Your break-even point is the sales level where total revenue covers total costs—meaning you make $0 profit, $0 loss.
A simple way to think about it:
- Identify your more fixed monthly costs (rent, core salaries, many subscriptions, insurance).
- Estimate your variable cost rate (COGS %, labor %, variable OpEx %).
- The higher your variable cost rate, the more sales you need to break even.
Pro Tip: Break-even isn’t a one-time calculation. Revisit it when rent changes, wages change, or your sales mix shifts toward delivery.
Common P&L mistakes restaurants make (and how to avoid them)
Restaurants don’t usually struggle because they “don’t care” about numbers. They struggle because reporting systems are imperfect, and the business moves fast. Here are the most common mistakes that distort decisions.
Mixing cash flow with profit
Profit is recorded when revenue is earned and expenses are incurred—not when money moves in or out of the bank. You might pay invoices late, receive deposits after the sale date, or have refunds hit later.
That’s why cash flow vs profit is a real-world issue:
- You can be profitable but cash-poor if receivables are slow or debt payments are high.
- You can have cash in the bank but be unprofitable if deposits include gift card sales, loans, or delayed vendor payments.
Pro Tip: Pair your P&L with a simple cash check: bank balance trend, upcoming payables, and payroll timing.
Misclassifying expenses
If packaging is sometimes in COGS and sometimes in OpEx, your food cost % becomes noisy. If repairs are mixed with supplies, you can’t see where spending is actually changing.
Fix: standardize your chart of accounts for restaurants and keep it consistent.
Ignoring comps/discounts and voids
Discounting affects margin just as much as food cost. If comps are not tracked as reductions to revenue, they can show up as inflated COGS (“we used product but didn’t record a sale”).
Fix: require comp reasons, track manager comps separately, and review weekly.
Not reconciling delivery marketplace fees
Delivery marketplaces can impact your P&L in multiple places:
- Fees may appear as OpEx, contra-revenue, or “cost of sales”
- Refunds/chargebacks can hit later
- Promotions may be partially funded and partially your cost
Fix: reconcile platform statements monthly and ensure fees are recorded consistently.
Pro Tip: If delivery sales are recorded net of fees, your “sales” line may be understated and your percentages will look artificially high. Ensure you know whether sales are gross or net.
How POS and accounting connect to P&L accuracy (category mapping and 2026 realities)
Your P&L is only as accurate as the data flowing into it. In 2026, restaurants often use multiple systems: POS, online ordering, delivery integrations, payroll, inventory tools, accounting software, and bank feeds. That’s powerful—but it introduces mapping risk.
Category mapping: the foundation of clean reporting
Category mapping means your POS sales categories align with accounting income accounts, and your purchasing categories align with COGS accounts. When mapping is inconsistent, you get:
- Food sales recorded as “misc”
- Delivery sales mixed with dine-in sales
- Discounts not captured consistently
- Taxes misposted (inflating “sales”)
- Refunds not matched to revenue periods
A reliable mapping approach includes:
- Clear sales categories (food, beverage, delivery, catering)
- Clear discount categories (promos, comps, loyalty)
- Clear payment categories (cash, card, gift card, house account)
- Clear COGS categories (food, beverage, packaging if included)
Pro Tip: If you change menu categories in the POS, update the accounting mapping the same week. Otherwise, your next P&L becomes a puzzle.
Taxes, tips, and refunds: common posting pitfalls
- Sales tax collected is not revenue; it’s a liability you owe.
- Tips are generally not restaurant revenue (even if they pass through payroll).
- Refunds should reduce revenue in the correct period when possible.
Make sure your accounting process distinguishes:
- Gross sales vs net sales
- Tax collected vs sales earned
- Tips paid out vs wages paid by the business
Delivery and online ordering fees
Fees can show up as:
- An OpEx line (delivery fees)
- A contra-revenue line (reducing sales)
- Included in merchant fees (if processed through certain setups)
Consistency matters more than the specific method. Choose one method, document it, and stick with it so your trends remain comparable.
Gift cards (high-level note)
Gift card sales are not revenue at the time of sale (you owe a future meal). Revenue is recognized when the gift card is redeemed. If gift card deposits are treated as revenue, your P&L will look inflated in high gift card months and depressed later.
Pro Tip: Ask your bookkeeper/accountant how gift card liability and redemption are handled, especially if you sell lots of gift cards during holidays.
Analyzing restaurant profit and loss reports over time (MoM, YoY, and budgeting vs actuals)
Reading one month of a P&L tells you what happened. Analyzing restaurant profit and loss reports over time tells you why it happened and whether it’s a trend.
Month-over-month (MoM): useful, but interpret carefully
MoM comparisons help you spot recent changes:
- A sudden spike in repairs
- A shift in labor % due to sales drop
- COGS increase due to vendor price changes
But MoM can be distorted by:
- Seasonality
- Different number of operating days
- Holiday patterns
- One-time costs (equipment replacement)
Use MoM to ask “what changed?”—not to judge performance in isolation.
Year-over-year (YoY): your best seasonality control
YoY comparisons are often the most useful in restaurants. Comparing the same month last year accounts for seasonal traffic patterns.
YoY helps you answer:
- Are vendor costs rising faster than our pricing?
- Is labor efficiency improving with experience?
- Are delivery fees increasing as a share of sales?
Pro Tip: When doing YoY, compare both dollars and percentages. Dollars show scale; percentages show efficiency.
Budgeting vs actuals: where management becomes proactive
Budgeting vs actuals turns your P&L into a plan. A budget doesn’t need to be perfect to be helpful. Even a simple budget improves decision-making because it creates a “target” to manage toward.
A practical budget approach:
- Forecast sales by category (food, beverage, delivery)
- Set target COGS % by category
- Build labor based on forecasted volume and staffing model
- Assign OpEx budgets (supplies, marketing, software)
- Track occupancy separately and plan for known changes
Then compare actuals to budget monthly and ask:
- Is this variance due to volume, price, mix, or control?
- What’s the operational cause?
- What decision will we make before next month ends?
Pro Tip: The goal of budgeting isn’t to predict perfectly—it’s to reduce surprises and create earlier course correction.
Practical actions to improve your P&L (real levers that actually work)
Improving margins is usually a series of operational habits, not one dramatic change. Focus on the levers you can control and measure.
Menu engineering and pricing (without guessing)
Menu work should be guided by contribution margin, not popularity alone.
- Identify high-selling, high-margin items and feature them.
- Identify low-margin items that sell a lot and adjust portion, recipe, or price.
- Identify items that don’t sell and simplify.
Contribution margin is the dollars left after direct costs (like food cost) to cover labor and overhead. Even if you don’t calculate it perfectly, you can make it practical:
- Know your top 20 sellers
- Know their approximate food cost
- Improve the mix with placement, server training, and menu design
Pro Tip: If raising prices feels risky, start with strategic moves: round up add-ons, adjust premium modifiers, and update items where vendor inflation has been highest.
Portion control and inventory discipline
Portion control is one of the fastest ways to stabilize food cost percentage.
Practical actions:
- Use standardized recipes and build cards that match line execution.
- Pre-portion proteins and high-cost items where feasible.
- Audit plate weights randomly during service.
- Tighten receiving: count, check quality, log price changes.
Inventory improvements that matter:
- Consistent count day and cutoff time
- Same methods and units each month
- Separate high-theft/high-cost items for tighter controls
Pro Tip: If you can’t count everything weekly, count “key items” weekly (proteins, alcohol, high-cost produce) and do full counts monthly.
Smarter scheduling and labor deployment
Labor control isn’t “cut hours.” It’s “deploy hours where they produce sales and service quality.”
Practical moves:
- Schedule to forecasted sales by daypart
- Reduce early opens or late closes that don’t pay back
- Cross-train to reduce single-point staffing
- Set overtime rules and coach managers weekly
Also track:
- Sales per labor hour
- Labor hours per cover (if relevant)
- Manager hours on the floor vs admin time
Pro Tip: Build schedules with labor dollars in mind, not just headcount. Two “strong” employees may replace three average ones without losing service quality.
Vendor negotiations and purchasing controls
Vendor control is not only about price—it’s also about consistency and waste.
Actions:
- Standardize specs to avoid “silent upgrades”
- Negotiate based on volume and commitment
- Compare price changes over time and adjust menu pricing accordingly
- Use pars and ordering calendars to prevent overbuying
Pro Tip: Don’t negotiate only when you’re upset. Schedule a quarterly vendor review and bring data: top items, price trends, and usage.
Reducing waste and comps without hurting guest experience
Waste and comps often spike when teams are stressed or systems are unclear.
Moves that help:
- Track comp reasons (service recovery vs employee error vs promo)
- Train teams on remake procedures and escalation
- Use prep plans based on forecast (not guesswork)
- Improve communication between FOH and BOH on modifiers and allergies
Pro Tip: A comp policy is a profit policy. Clear rules reduce conflict and protect guest experience.
A monthly P&L review meeting playbook (who attends, what to bring, what to decide)
A P&L review meeting shouldn’t be a blame session or an accounting lecture. It should be a structured operating meeting where leaders learn and make decisions.
Who attends
Keep it tight:
- Owner / operator (or multi-unit leader)
- General manager
- Chef / kitchen lead
- Bar manager (if applicable)
- Bookkeeper/accounting partner (optional but helpful)
What reports to bring
Bring the same set every month:
- Monthly P&L (current month + prior month + same month last year)
- Sales by category report (food/bev/delivery/catering)
- Discounts/comps/voids summary
- Labor report (hours, overtime, SPLH)
- Inventory summary (COGS detail and key item variances)
- Delivery marketplace statements (fees, refunds, promos)
- Budget vs actuals (even a simple version)
Pro Tip: If the team shows up without the supporting reports, you’ll spend the meeting arguing about whether the P&L is “right” instead of improving performance.
Meeting agenda (60–90 minutes)
- Sales mix review (10–15 min): What changed? Dine-in vs delivery? Beverage mix? Promotions?
- COGS review (10–15 min): Food cost % and beverage cost % vs targets. Waste signals and vendor price changes.
- Labor review (10–15 min): Labor % vs targets. Scheduling effectiveness and overtime.
- Prime cost review (10 min): Are we controlled? If not, which driver is the priority?
- OpEx + occupancy review (10–15 min): Big swings, creep, and contract reviews.
- Decisions + assignments (10–15 min): 3–5 actions with owners, dates, and measurable targets.
What decisions to make
Examples of good meeting outcomes:
- Adjust menu pricing on 6 items to restore margin
- Implement weekly key-item inventory counts
- Update scheduling rules for slow dayparts
- Standardize comp policy and require reasons
- Audit delivery fees and posting method; fix category mapping
- Cancel or renegotiate underused software subscriptions
Pro Tip: End with a “next month success definition.” If you don’t define what better looks like, you won’t manage toward it.
Weekly P&L vs monthly P&L: how to use both without burning out
Monthly P&Ls are standard because invoices and accounting processes usually close monthly. But waiting for the month-end can be too slow to catch drift—especially with food cost spikes, overtime, or delivery fee changes.
Monthly P&L: best for accuracy and full review
Use monthly P&Ls for:
- Full expense picture (invoices, accruals, rent, utilities)
- Trend tracking and budgeting
- Strategic decisions (pricing, staffing model, vendor changes)
Weekly P&L: best for speed and early course correction
Weekly P&Ls are often “flash” reports that prioritize speed over perfection. They typically include:
- Sales by category
- Labor costs from payroll reports
- Purchases (sometimes instead of full COGS)
- Key operational metrics
Weekly P&Ls help you catch:
- Discounting creep
- Labor deployment issues
- Purchase spikes and waste signals
- Sales mix shifts
Pro Tip: Use weekly reporting to manage operations, and monthly reporting to validate and refine. Weekly tells you where to look; monthly tells you what was true.
If weekly P&Ls feel hard, start with a weekly dashboard scorecard (next section). It delivers most of the benefit with less complexity.
Weekly dashboard KPIs (so you don’t wait for month-end)
This is the operator’s secret: if you manage the right weekly KPIs, your month-end P&L rarely surprises you. A weekly scorecard should be short enough to review in 15 minutes and consistent enough to build habits.
Core weekly KPIs to track
Sales and mix:
- Total net sales
- Sales by category (food, beverage, delivery, catering)
- Average check (and/or average ticket by channel)
- Discounts/comps % of sales
COGS and inventory signals:
- Key item usage vs sales (proteins, high-cost items)
- Purchases this week (by major category)
- Waste/spoilage log count (even if basic)
Labor:
- Total labor % (estimated weekly)
- Sales per labor hour (SPLH)
- Overtime hours
- Training hours (if relevant)
Channel economics:
- Delivery fee % of delivery sales
- Refunds/chargebacks count
- Packaging cost trend (if tracked)
Service/operations (optional but helpful):
- Guest count / covers
- Table turns (if dine-in)
- Review score or guest complaints count
Pro Tip: Don’t add more KPIs until you’re acting on the ones you already track. A dashboard without actions becomes noise.
How to use the weekly dashboard
- Review weekly with GM + chef (and bar lead if applicable)
- Identify 1–2 focus areas for the upcoming week
- Make one operational change and measure it the next week
This rhythm turns numbers into leadership—and it protects your month-end results.
“Red flags” checklist: what to investigate when numbers swing
When your P&L swings, your job is to separate data issues from real operational issues. Use this checklist to guide investigation quickly.
Table 3: Red flags checklist (what to investigate when numbers swing)
| Red Flag | What It Might Mean | What to Investigate First |
|---|---|---|
| Sales down but covers steady | Average check dropped or discounting increased | Menu mix, discount reports, promo usage, voids/refunds. |
| Food cost % spikes suddenly | Waste, portion drift, inventory error, missing credits | Inventory count accuracy, key item usage, vendor credits, recipe adherence. |
| Beverage cost % climbs | Over-pouring, theft, promo mix, inventory issues | Pour tests, comped drinks, inventory controls, purchase timing. |
| Labor % jumps even with stable sales | Overtime, overstaffing, wage increases, training | Overtime reports, schedule vs forecast, turnover/training hours. |
| Prime cost rises but team “feels” busy | Sales mix shift (more delivery/low margin), discounts | Channel mix, delivery fees, discount % trend, contribution margin by channel. |
| OpEx creeps up month after month | Subscription stacking, vendor rate increases | Recurring charges audit, contract renewals, usage review. |
| Merchant fees rise faster than sales | Higher keyed entries, fee changes, channel shift | Effective rate, keyed vs swiped %, processor statement review. |
| Delivery sales look strong but profit drops | Fees/refunds/promos reducing net contribution | Marketplace statements, fee classification, refund trends, packaging costs. |
| Utilities spike | Equipment issue or usage change | HVAC/refrigeration performance, leaks, seasonal patterns, maintenance logs. |
| Profit up but cash feels tight | Timing issues, debt, payables, deposits vs sales | Payables schedule, payroll timing, loan payments, gift card liability handling. |
Pro Tip: Always confirm whether the swing is real by checking classification and timing first. Fixing the bookkeeping issue can “solve” the problem—or reveal the real one.
Frequently asked questions
Q1) What is a restaurant profit and loss statement?
Answer: A restaurant profit and loss statement is a report that summarizes revenue and expenses over a period (usually monthly) and shows whether the restaurant made a profit or loss.
It’s also called an income statement for restaurants. The value isn’t just the final profit number—it’s the breakdown of sales, COGS, labor, operating expenses, and occupancy that tells you what to fix.
Q2) How often should restaurants review their P&L?
Answer: Most restaurants should do a full P&L review monthly, because that’s when invoices and accounting are typically complete. For faster control, many operators also use weekly dashboards or weekly “flash” P&Ls to catch changes early—especially for labor, discounting, and purchasing.
Q3) What is prime cost and why does it matter?
Answer: Prime cost is COGS plus labor—your two largest and most controllable costs. Prime cost matters because it reflects how well you’re controlling operations. If prime cost is off, it usually points to portioning/waste issues, scheduling/coverage issues, or both.
Q4) What is a “good” food cost percentage?
Answer: There isn’t one universal number. Food cost percentage depends on concept type, menu mix, pricing strategy, and portion size. What matters most is consistency and trend: are you holding food cost near your target range and reacting quickly when it drifts?
Q5) Why does my restaurant show profit but I’m short on cash?
Answer: Because profit and cash flow are different. Your P&L records revenue and expenses when they’re earned/incurred. Cash depends on timing—when deposits hit, when invoices are paid, loan payments, and inventory buying. Gift cards and delayed payables can also create a gap between profit and cash.
Q6) How do delivery apps affect my P&L?
Answer: Delivery apps can affect revenue reporting, fees, refunds, promotions, and packaging costs. Depending on how accounting is set up, fees may reduce revenue or appear as an expense. The key is consistency and monthly reconciliation of platform statements so you can understand contribution margin for delivery.
Q7) How do comps and discounts show up on the P&L?
Answer: Ideally, comps and discounts show as reductions to gross sales, resulting in net sales. If they aren’t tracked properly, they can inflate COGS (product used with no recorded sale) and distort gross margin. Require comp reasons and review discount trends weekly.
Q8) What expenses are controllable vs fixed?
Answer: Controllable expenses are the ones you can influence in the short term: scheduling, purchasing, waste, supplies, many marketing choices, and some subscriptions. Fixed expenses change less month-to-month: rent, many contracts, and baseline management salaries. Most categories are partially controllable, so focus on the biggest drivers first.
Q9) Should I run weekly or monthly P&Ls?
Answer: Use both if you can. Monthly P&Ls are more accurate and complete. Weekly P&Ls (or weekly dashboards) are faster and help you catch drift early. If weekly P&Ls are too heavy, start with weekly KPIs and a consistent monthly review meeting.
Q10) Can POS reports replace accounting statements?
Answer: POS reports are essential for sales mix, discounts, and operational insights, but they don’t replace accounting statements. Accounting captures invoices, accruals, payroll taxes, occupancy costs, and consistent categorization. The best setup uses POS for daily/weekly management and accounting for monthly truth.
Q11) What’s the difference between gross profit and net profit?
Answer: Gross profit is sales minus COGS. Net profit (or operating profit) accounts for labor, OpEx, and occupancy too. Gross profit tells you if product economics work; net profit tells you if the full business model works at your current volume.
Q12) What is the contribution margin in a restaurant?
Answer: Contribution margin is what’s left after direct, variable costs to help cover fixed costs and profit. Many operators use it to compare channels (dine-in vs delivery) or menu items. It’s especially useful when evaluating promotions or delivery growth.
Q13) What’s the break-even point and why should I know it?
Answer: Break-even is the sales level where revenue covers all costs. Knowing it helps you plan staffing, set sales goals, and evaluate whether the location’s fixed costs (like rent) are sustainable at your typical volume.
Q14) Why do my percentages look worse when sales dip?
Answer: Many costs don’t decrease as quickly as sales—especially fixed or semi-fixed costs like rent and core management labor. That’s why percentages can worsen even if dollars are stable. This is also why sales forecasting and early correction matter.
Q15) What’s the fastest way to improve my P&L without hurting guest experience?
Answer: Start with controls that reduce waste and improve deployment: tighten portioning on high-cost items, reduce unplanned comps, schedule to forecast by daypart, and audit recurring OpEx charges. These moves protect guest experience while improving margins.
Conclusion
A restaurant profit and loss statement isn’t just an accounting document—it’s a leadership tool. When you know how to read a restaurant P&L statement, you stop guessing and start managing: sales mix, COGS discipline, labor deployment, and OpEx control become clear levers instead of vague worries.
The goal isn’t perfection. The goal is consistency: accurate categories, reliable timing, and a repeatable review process. Do that, and analyzing restaurant profit and loss reports becomes one of the most confidence-building skills you can develop as an operator.