

Restaurant operations generate information throughout every shift. Every order entered, menu item sold, discount applied, employee clock-in, payment accepted, refund processed, and ingredient used creates data that can help operators understand what is happening inside the business.
Restaurant POS reporting turns that activity into organized reports. Instead of relying only on observation or memory, owners and managers can review sales totals, payment activity, labor hours, menu performance, inventory movement, customer behavior, and operational trends.
For a café, reporting may reveal which drinks sell during the morning rush. A bar may use reports to compare beverage sales across happy hour and late-night service. A quick-service operator may study order volume and average ticket size by 15-minute intervals, while a multi-location group may compare labor cost, menu mix, and revenue across stores.
Reports do not make decisions by themselves. Their value comes from helping managers ask better questions, investigate unusual results, and take practical action.
This guide explains how restaurant POS reports work, which reports deserve regular attention, and how restaurant teams can use sales, labor, inventory, payment, menu, and customer data responsibly.
What Is Restaurant POS Reporting?
Restaurant POS reporting is the process of collecting, organizing, and reviewing information recorded by a point of sale system. The POS captures transactional activity as employees enter orders, apply modifiers, accept payments, record tips, issue refunds, and close checks.
Restaurant reporting software then groups that information into summaries, dashboards, charts, and downloadable reports. A manager might view sales by hour, payment type, menu category, employee, location, or order channel.
A well-configured restaurant POS system can connect order entry, payments, discounts, taxes, menu items, and transaction history. When the underlying setup is accurate, its reports can provide a dependable view of daily activity.
Restaurant POS reporting may include:
- Gross and net sales
- Number of orders or checks
- Average ticket size
- Sales by menu item or category
- Cash and card payment totals
- Discounts, comps, voids, and refunds
- Employee hours and sales activity
- Tips and service charges
- Tax categories
- Inventory usage and variance
- Customer and loyalty activity
- Location-level performance
The exact reports available depend on the POS configuration and connected tools. Some systems focus mainly on POS sales reporting, while others combine sales, scheduling, inventory, customer management, and payment data in one restaurant reporting dashboard.
What Restaurant POS Reports Show
Restaurant POS reports organize operational data into categories that managers can review without examining every transaction individually.
A daily sales report may show gross sales, net sales, taxes, tips, discounts, refunds, and order volume. A payment report may divide transactions among cash, credit cards, debit cards, digital wallets, gift cards, and online ordering channels.
Menu reports show how many units of each item were sold and how much revenue each item generated. Labor reports may show scheduled hours, actual clocked hours, overtime indicators, and labor cost. Adjustment reports identify voids, comps, refunds, and discounts.
These reports can also show when activity occurred. Daypart reporting separates breakfast, lunch, dinner, happy hour, or late-night sales. Hourly reports identify peak periods, while shift reports show what happened during a specific manager’s or team’s shift.
The result is a structured record of restaurant activity rather than a collection of disconnected receipts, spreadsheets, and handwritten notes.
Why POS Reporting Is More Than Sales Tracking
Sales totals are important, but restaurant POS analytics extend beyond revenue.
For example, strong sales can still occur alongside excessive discounts, high labor hours, ingredient waste, or unusually frequent refunds. A restaurant may increase revenue while its average ticket decreases, suggesting that order volume rather than guest spending is driving growth.
Restaurant performance reports help managers connect different parts of the operation. Sales can be compared with labor hours, menu demand with ingredient usage, and payment totals with deposits.
Reports can answer questions such as:
- Which menu categories perform best at lunch?
- Are scheduled hours aligned with customer demand?
- Which ingredients are being used faster than expected?
- Are discounts concentrated during certain shifts?
- Do online orders have a different average ticket?
- Which location has the strongest table turnover?
- Are refund patterns connected to a menu or service issue?
Why POS Reporting for Restaurants Matters

Restaurants operate with narrow timing, perishable inventory, variable demand, and constantly changing labor needs. Delayed or incomplete information can lead to overstaffing, shortages, cash discrepancies, unnecessary waste, and missed sales opportunities.
POS reporting for restaurants gives managers a more consistent way to review daily activity. It supports cash control, payment reconciliation, menu planning, staff scheduling, purchasing, cost monitoring, and multi-location oversight.
Accurate reporting is especially valuable because restaurant performance can change quickly. Weather, local events, holidays, promotions, delivery demand, menu changes, and employee availability can all affect results.
Restaurant operations reporting helps managers separate one-time events from recurring patterns. A slow afternoon may not require action, but several slow afternoons may justify a schedule or menu adjustment.
Useful reports also improve communication. Instead of saying that a shift “felt busy,” a manager can point to order volume, sales per hour, table turnover, ticket times, or average check data.
Reports should support judgment rather than replace it. Managers still need to consider service quality, customer feedback, employee workload, ingredient availability, and local circumstances before making changes.
Better Daily Decision-Making
Daily restaurant management reports help operators respond to immediate needs.
A manager can review stock movement before placing an order, check hourly sales before deciding whether to send staff home, or examine discount activity after noticing an unusual decline in net sales.
During an active shift, real-time reporting may reveal:
- Higher-than-expected order volume
- A sudden increase in online orders
- Low sales in a particular menu category
- A payment device or order channel problem
- A critical ingredient approaching its minimum level
- Labor hours rising faster than sales
- Longer service times during a peak period
The best response depends on context. High order volume may require more preparation support, while high labor percentage during a quiet opening hour may simply reflect required setup work.
Daily reports are most useful when paired with manager notes. Recording a local event, equipment issue, weather disruption, or large catering order gives future reviewers context that numbers alone cannot provide.
Better Long-Term Planning
Restaurant reporting software also helps owners analyze patterns across weeks, months, seasons, and locations.
Long-term restaurant data analytics may show that a menu category is gradually losing demand, weekend labor hours are rising faster than sales, or a seasonal item consistently performs well during a particular period.
Operators can compare:
- Week-over-week sales
- Comparable days and shifts
- Menu performance before and after a price change
- Labor cost across scheduling periods
- Average ticket by order channel
- Seasonal ingredient usage
- Promotional periods with ordinary periods
- New and repeat customer activity
- Location-level performance
Long-term comparisons should use similar periods whenever possible. Comparing a holiday weekend with an ordinary weekend may create misleading conclusions.
Restaurant POS Reports Compared
Restaurant POS systems may offer dozens of reports, but most operators rely on a smaller group for recurring decisions.
| Report Type | What It Shows | Why It Matters | Best Use Case |
| Daily sales report | Sales, taxes, tips, discounts, orders | Tracks daily performance | End-of-day review |
| Payment report | Cash, cards, wallets, gift cards | Supports reconciliation | Deposit matching |
| Menu item report | Items sold, quantities, revenue | Shows menu performance | Menu planning |
| Labor report | Hours, shifts, estimated labor cost | Helps manage staffing | Schedule review |
| Inventory report | Stock usage, counts, variance | Supports food cost control | Ordering decisions |
| Discount and comp report | Discounts, comps, reasons | Reveals revenue adjustments | Manager review |
| Void report | Canceled items and checks | Highlights transaction changes | Control review |
| Refund report | Refunded transactions | Tracks service or billing issues | Issue investigation |
| Customer report | Visit, spend, and order trends | Supports loyalty decisions | Marketing planning |
| Daypart report | Sales by time period | Shows demand patterns | Staffing and prep |
| Multi-location report | Performance by location | Supports comparison | Group management |
| Dashboard report | Key metrics in one view | Speeds routine review | Owner overview |
Not every report requires the same review frequency. Daily reports should support closing and reconciliation. Weekly reports are better suited to menu, labor, inventory, and adjustment analysis. Monthly reports provide a wider view of customer activity, trends, and location performance.
How to Use the Table When Reviewing Reports
Begin with the reports connected to the decision being made.
For an end-of-day close, review the daily sales report, payment report, cash drawer report, discount report, refund report, and open-check activity. These help confirm that transactions were completed and recorded correctly.
For weekly planning, focus on restaurant sales reports, menu item performance, labor hours, daypart activity, inventory variance, and adjustment trends. These reports help with scheduling, ordering, preparation, and manager coaching.
Monthly reviews can include restaurant business reports covering customer trends, location comparisons, category performance, average ticket movement, and longer-term cost indicators.
A simple routine is often more effective than reviewing every available report. Choose a core group, define who reviews each report, and document what requires follow-up.
Why Report Priorities Depend on Restaurant Type
Different service models create different reporting priorities.
A café may focus on morning sales, beverage modifiers, pastry waste, and transactions per hour. A bar may pay closer attention to beverage categories, discounts, tabs, voids, tips, and cash drawer activity.
A full-service restaurant may prioritize table turnover, server sales, check averages, course timing, comps, and tip reports. A quick-service restaurant may emphasize order volume, speed, hourly sales, labor deployment, and digital order channels.
Food truck operators often need mobile payment totals, event-level sales, item availability, and location-based comparisons. Multi-location groups need standardized restaurant performance reports that allow fair comparisons across stores.
The most useful report is the one that supports a real operational decision. Operators should avoid measuring a metric simply because it appears on the dashboard.
Daily Sales Reports
The daily sales report is one of the most frequently used restaurant POS reports. It summarizes the financial and transactional activity recorded during a business day.
Depending on the system, the report may include gross sales, net sales, taxes, tips, service charges, discounts, comps, voids, refunds, order volume, guest count, and average ticket size.
Managers should confirm how their system defines each figure. One POS may display voided items outside gross sales, while another may include them before adjustments. Online ordering, gift card sales, deposits, and service charges may also be categorized differently.
Common daily sales metrics include:
- Gross sales: Sales before specified deductions
- Net sales: Sales after discounts, comps, refunds, or other configured adjustments
- Order volume: Number of transactions or checks
- Average ticket: Sales divided by the relevant number of orders or checks
- Guest count: Number of recorded guests or covers
- Taxes: Amount collected in configured tax categories
- Tips: Gratuities recorded through the POS
- Discounts and comps: Authorized reductions
- Refunds: Amount returned after payment
- Voids: Items or transactions canceled before completion
Daily reports provide a starting point, but unusual results should be investigated through transaction details, shift notes, payment records, and operational context.
Gross Sales vs. Net Sales
Gross sales generally represent the value of sales before specified reductions. Net sales represent the remaining sales amount after the POS subtracts the adjustments included in its configuration.
Suppose a restaurant records $8,000 in menu sales, $250 in discounts, $100 in comps, and $150 in refunds. Depending on the system’s setup, the net sales figure may reflect some or all of those deductions.
Managers should not assume every platform calculates net sales identically. The report definition, accounting configuration, and treatment of taxes, tips, gift cards, service charges, and refunds can affect the totals displayed.
Gross sales help show the original value of recorded demand. Net sales provide a closer view of recognized sales after adjustments.
For specific accounting or tax treatment, restaurants should have their setup and reporting process reviewed by a qualified professional.
End-of-Day Sales Review
An end-of-day report helps the closing manager verify that the shift is complete and major totals appear reasonable.
The review may include:
- Confirming all checks are closed
- Reviewing gross and net sales
- Checking discounts, comps, voids, and refunds
- Comparing payment totals with cash and card records
- Reviewing tips and service charges
- Confirming cash drawer counts
- Recording over-or-short amounts
- Checking unresolved transactions
- Saving or exporting required summaries
- Adding manager notes
A variance does not automatically indicate wrongdoing. It may result from a data-entry mistake, incorrect tender selection, delayed online payment, refund timing, payout, or cash-counting error.
Payment Reports and Reconciliation
Restaurant payment reports summarize how guests paid. They may include cash, credit cards, debit cards, digital wallets, gift cards, house accounts, online payments, delivery-platform payments, and other configured tenders.
Payment reporting is essential because sales and payments are related but not identical. A sale records what was purchased, while a payment report records how the transaction was settled.
A restaurant may record $10,000 in net sales but show a different payment total because of taxes, tips, gift card activity, deposits, refunds, service charges, or timing differences.
Payment reconciliation compares POS records with supporting records such as:
- Cash counts
- Card batch summaries
- Processor reports
- Online ordering statements
- Gift card activity
- Deposit records
- Refund logs
- Bank deposits
Integrated systems can reduce manual work, but they do not remove the need for review. Configuration errors, failed batches, duplicate entries, and timing differences can still occur.
Matching POS Payments to Deposits
POS payment totals may not match a bank deposit exactly on the same day.
Card processing fees may be deducted before funding or billed separately. Transactions completed after a batch cutoff may appear in a later deposit. Refunds, chargebacks, reserves, corrections, and settlement adjustments can also change the funded amount.
A useful reconciliation process compares:
- POS card totals
- Batch totals
- Processor settlement reports
- Gross funded amount
- Fees or adjustments
- Net bank deposit
- Deposit date
Managers should document timing differences rather than repeatedly treating them as unexplained shortages.
Reconciliation procedures should be reviewed with an accountant or payment professional because settlement structures and recordkeeping needs vary.
Cash Drawer and Till Reports
A cash drawer report tracks the movement of cash during a shift.
It may include:
- Starting cash
- Cash sales
- Cash refunds
- Paid-outs
- Paid-ins
- Tip payouts
- Cash drops
- Expected closing cash
- Actual closing cash
- Over-or-short amount
The expected amount comes from recorded POS activity. The actual amount is determined through a physical count.
Cash discrepancies can result from incorrect change, wrong payment-type selection, unrecorded payouts, counting errors, misplaced receipts, or unauthorized activity. Managers should investigate patterns instead of treating every small difference the same way.
Assigning drawers to specific employees or shifts may improve accountability, but employee reports should always be interpreted fairly and in context.
Menu Item Reports and Menu Performance
Restaurant menu reports show what guests are buying. They may display quantity sold, revenue, average selling price, modifiers, discounts, voids, comps, and performance by category or daypart.
Menu reports help operators understand the difference between popularity and financial contribution. A high-selling item may generate substantial revenue but require expensive ingredients or intensive preparation. A lower-volume item may be valuable because it has a favorable margin or supports a broader menu category.
Useful menu performance measures include:
- Units sold
- Item revenue
- Category revenue
- Average selling price
- Modifier frequency
- Discount frequency
- Void and comp activity
- Daypart performance
- Order-channel performance
- Estimated contribution after item costs
A connected restaurant reporting and analytics dashboard may combine menu sales with labor, inventory, customer, and location information, making it easier to review performance from several perspectives.
Identifying Best-Selling Menu Items
Best-selling items can be identified by quantity, revenue, margin contribution, or repeat purchase behavior. These measures do not always point to the same item.
A low-priced beverage may lead in units sold, while an entrée leads in revenue. A profitable add-on may have lower volume but contribute meaningfully to each check.
Managers can use restaurant menu reports to:
- Protect availability of popular items
- Prioritize preparation during peak periods
- Feature high-demand items appropriately
- Train employees on relevant pairings
- Check whether promotions are changing demand
- Review which modifiers are frequently selected
High sales should also be compared with refund, comp, and complaint activity. Popularity alone does not confirm that an item is being prepared consistently.
Reviewing Low-Performing Menu Items
A low-performing item is not automatically a bad item.
Its results may reflect poor menu placement, an unclear name, limited availability, inconsistent preparation, long ticket time, incorrect POS categorization, or a price that does not match guest expectations.
Before removing an item, managers can examine:
- Units sold over a meaningful period
- Sales by daypart
- Ingredient overlap with other items
- Preparation complexity
- Waste associated with the item
- Guest feedback
- Modifier and substitution activity
- Profit contribution
- Seasonal demand
A menu change should be monitored after implementation. Comparing performance before and after a price, recipe, placement, or description change can show whether the adjustment had the intended effect.
Restaurant POS Analytics for Food Cost Control
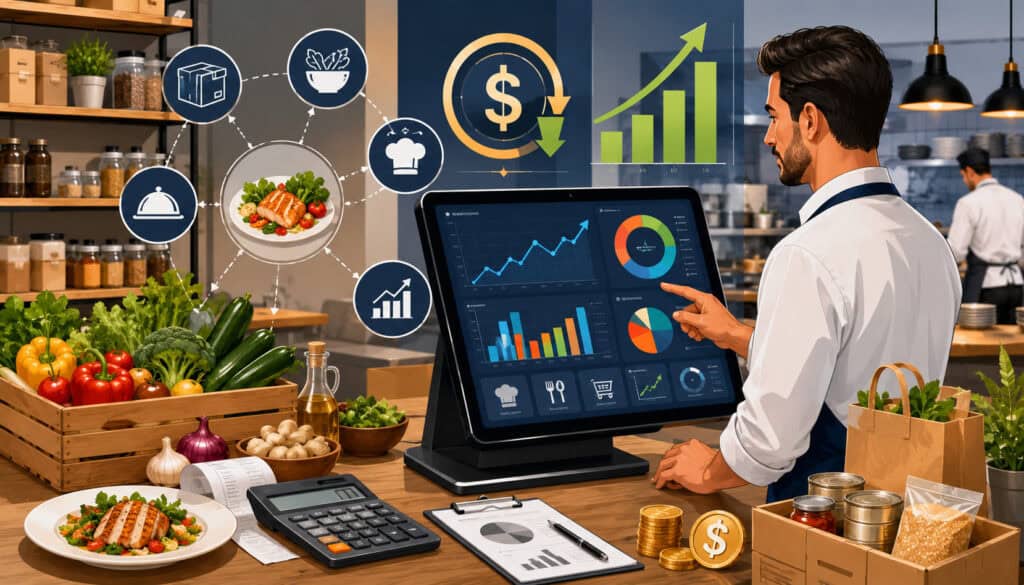
Restaurant POS analytics can support food cost control when sales data is connected with recipes, ingredient quantities, inventory counts, receiving records, and waste logs.
The POS records what was sold. Recipe mapping translates those sales into expected ingredient usage. Inventory counts show what remains. The difference between expected and actual inventory creates a variance that managers can investigate.
For example, if 100 burgers were sold and each recipe uses one patty, expected usage is 100 patties. If inventory declined by 115 patties, the difference may relate to waste, spoilage, incorrect portioning, staff meals, complimentary items, receiving errors, or inaccurate counts.
Restaurant inventory reporting tools can help organize stock levels, ingredient movement, low-stock signals, purchasing activity, and waste patterns. The usefulness of these reports depends on accurate recipes, consistent units of measure, timely receiving, and reliable physical counts.
Restaurants can also use sales, inventory, and waste records together to identify cost leaks, as explained in this guide to using restaurant data to reduce food waste. POS reports provide operational guidance, not a substitute for professional accounting or financial review.
Sales Data and Ingredient Usage
When menu items are mapped to standardized recipes, item sales can estimate how much inventory should have been consumed.
A recipe may include:
- Main ingredients
- Garnishes
- Sauces
- Packaging
- Side items
- Common modifiers
- Preparation loss assumptions
Accurate mapping matters. If a recipe uses ounces but inventory is purchased in pounds, the system must convert the units correctly. Modifier choices must also be connected to ingredient usage.
Expected usage is an estimate, not a physical count. Ingredient substitutions, overportioning, spills, staff meals, unrecorded waste, and recipe changes can create differences.
Inventory Variance Reports
Inventory variance compares expected stock with actual stock.
A negative variance means less inventory is available than expected. A positive variance means more is available than the records predicted.
Possible causes include:
- Incorrect receiving quantities
- Counting mistakes
- Recipe mapping errors
- Unrecorded waste
- Spoilage
- Overportioning
- Substitutions
- Theft
- Transfers between locations
- Inconsistent units of measure
Variance reports should trigger investigation rather than immediate conclusions. Repeated variance in the same ingredient is more informative than one isolated difference.
Managers can review variance alongside purchase records, waste logs, employee notes, menu sales, and storage practices to find the likely cause.
Labor Reports and Scheduling Insights
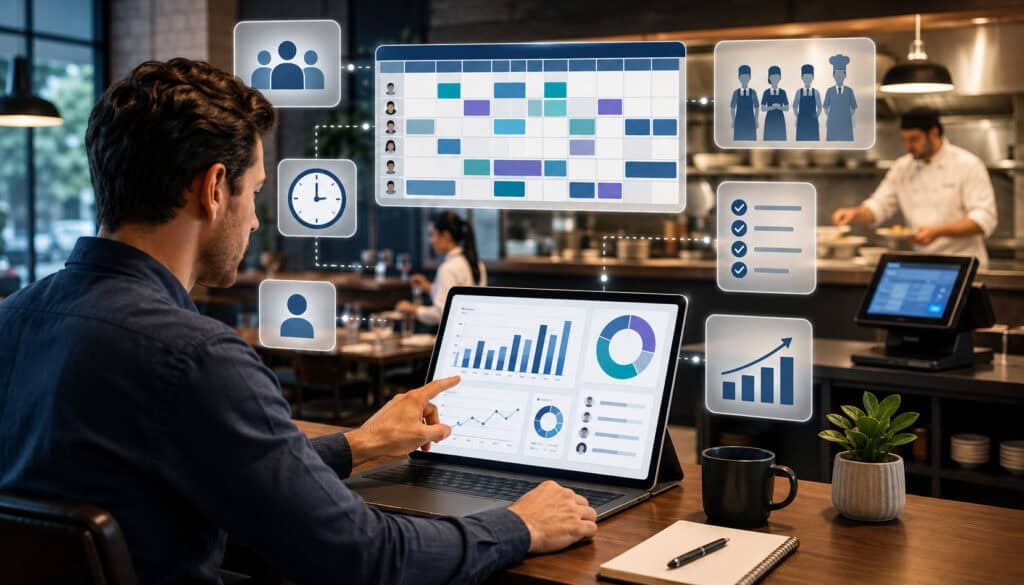
Restaurant labor reports summarize employee time and scheduling activity. They may show scheduled hours, clocked hours, breaks, overtime indicators, labor cost estimates, sales per labor hour, and labor cost percentage.
Labor reports help managers compare staffing with demand. A restaurant needs enough employees to provide safe, consistent service, but too many scheduled hours during slow periods can reduce operational efficiency.
Useful labor comparisons include:
- Scheduled hours versus actual hours
- Labor hours by role
- Labor cost by daypart
- Sales per labor hour
- Labor percentage
- Overtime patterns
- Early clock-ins
- Late clock-outs
- Missed or incorrect punches
- Staffing levels during peak periods
The Department of Labor provides general wage and hour recordkeeping guidance, but restaurants should seek professional assistance for questions involving payroll, overtime, breaks, scheduling, or employment requirements.
A more detailed guide to labor cost analytics for restaurants can help operators understand how staffing hours, sales levels, employee roles, and scheduling patterns affect labor performance.
Time and pay records may be subject to employment and recordkeeping requirements. The Department of Labor provides general information on employer recordkeeping, but restaurants should obtain professional guidance for questions involving wages, hours, breaks, overtime, payroll, scheduling, or employment rules.
Labor Cost Percentage
Labor cost percentage compares labor cost with a selected sales measure.
A common operational formula is:
Labor cost percentage = Labor cost ÷ Sales × 100
If labor cost is $2,500 and the relevant sales figure is $10,000, the calculated percentage is 25%.
The calculation is only useful when managers use consistent definitions. They must know which labor costs and which sales figure are included.
A higher percentage is not always negative. Training, opening preparation, deep cleaning, low-volume periods, or increased service standards can affect the result.
Managers should review labor cost percentage with order volume, customer service, ticket times, employee workload, and sales mix rather than treating it as an isolated target.
Scheduled Hours vs. Actual Hours
Comparing scheduled hours with clocked hours shows whether the staffing plan matched what happened.
Differences may result from:
- Employees arriving early
- Employees staying late
- Shift changes
- Call-outs
- Unplanned overtime
- Break timing
- Incorrect punches
- Managers adding coverage
- Closing duties taking longer than expected
A repeated pattern of late clock-outs may indicate inefficient closing procedures, unrealistic schedules, unexpected demand, or inadequate staffing earlier in the shift.
Managers should correct inaccurate time records through approved procedures and avoid making employment decisions from incomplete POS data.
Employee Performance Reports
Employee reports may show sales activity, average ticket, table turnover, tip totals, voids, comps, discounts, refunds, order accuracy indicators, and clocked hours.
These reports can support coaching, but they must be used carefully. Employees do not always work under comparable conditions.
A server handling a large section during dinner has a different opportunity than an employee assigned to a quiet lunch shift. A cashier processing pickup orders may have little influence over average ticket size. A bartender may record more voids because of the way open tabs and drink changes are handled.
Reports should help managers investigate workflows and identify training needs, not automatically label employees as strong or weak.
Using Employee Reports Fairly
Before comparing employees, consider:
- Job role
- Shift length
- Daypart
- Section size
- Guest volume
- Menu availability
- Order channel
- Assigned responsibilities
- Experience level
- Team support
- Large-party or event activity
An employee with a lower average ticket may have served smaller parties. A higher refund count may reflect management assigning that employee to resolve guest issues.
Role-based permissions can protect sensitive reports and limit access to authorized users. A centralized employee management system may also help organize roles, attendance information, and operational access.
Employee reporting should be consistent, documented, and reviewed with appropriate employment guidance.
Finding Training Opportunities
Patterns in employee reports may point to areas where additional coaching could help.
Examples include:
- Incorrect discount use
- Frequent payment-type errors
- High modifier corrections
- Repeated voids after orders reach the kitchen
- Difficulty closing checks
- Low use of relevant add-ons
- Incomplete customer information
- Cash drawer discrepancies
- Unusual refund activity
Managers should confirm the underlying cause before assigning training. A POS design problem, unclear policy, menu configuration error, or equipment issue may affect several employees.
Coaching is more useful when it is specific. “Review the gift card redemption process” provides clearer direction than “improve POS performance.”
Discount, Comp, Void, and Refund Reports
Discounts, comps, voids, and refunds all reduce or change recorded revenue, but they represent different events.
A discount changes the price according to an approved offer or rule. A comp removes some or all of a charge, often for service recovery or an authorized business purpose. A void cancels an item or transaction before completion. A refund returns money after payment.
Adjustment reports should include the amount, employee, manager approval, time, reason, menu item, payment method, and transaction reference where available.
Common reasons include:
- Promotions
- Employee or approved partner meals
- Incorrect orders
- Guest complaints
- Duplicate charges
- Unavailable items
- Payment errors
- Canceled orders
- Quality concerns
- Delivery issues
The goal is not to eliminate legitimate adjustments. It is to make them consistent, explainable, and reviewable.
Why Managers Should Review Adjustments
Unusual adjustment patterns may reveal:
- Training gaps
- Menu confusion
- Service problems
- Equipment issues
- Pricing errors
- Poor discount controls
- Fraud risk
- Incorrect permissions
- Repeated preparation problems
A high number of voids for one menu item may indicate that employees frequently select the wrong button. Refunds concentrated in online orders may point to packaging or delivery problems.
Managers should review frequency, value, reason, timing, employee, and menu item. Context matters more than one isolated transaction.
Building Approval Controls
POS permissions can limit who may apply discounts, issue refunds, reopen checks, or void items.
A practical control process may require:
- Individual employee logins
- Manager approval above set limits
- Standard reason codes
- Written notes for unusual adjustments
- Restricted access to refund functions
- Shift-level review
- Supporting receipts or records
- Periodic permission checks
Shared login credentials weaken accountability. Each employee should use an assigned account with access appropriate to the role.
Controls should be strong enough to protect the business without making legitimate service recovery unnecessarily difficult.
Customer Reports and Loyalty Insights
Restaurant customer reports may show visit frequency, average spend, order history, favorite items, loyalty activity, redemption behavior, and preferred ordering channels.
Customer data can help operators identify broad trends. A café may learn that loyalty members visit most often in the morning, while a restaurant may find that repeat guests frequently order takeout during weekdays.
Useful customer measures include:
- New versus returning guests
- Visit frequency
- Average spend
- Order channel
- Popular items
- Loyalty points earned and redeemed
- Offer response
- Time between visits
- Customer segment activity
Not every transaction is tied to a known guest. Customer reports therefore represent the portion of activity connected to profiles, loyalty accounts, reservations, or digital orders.
Understanding Customer Behavior
Restaurant customer reports can support menu and communication decisions.
For example, operators may identify groups that prefer vegetarian items, family meals, weekday lunch orders, premium beverages, or late-night service. These insights may help restaurants create more relevant offers or improve item availability.
Customer trends should be reviewed in aggregate whenever possible. A small number of transactions may not represent a dependable pattern.
Customer data should also be combined with operational judgment. A popular offer that produces long kitchen delays may not be beneficial without workflow changes.
Protecting Customer Data
Restaurants should collect only information they have a legitimate reason to use and should restrict access according to job responsibilities.
Good practices include:
- Limiting employee permissions
- Using secure passwords and authentication
- Avoiding unnecessary exports
- Removing access when roles change
- Reviewing connected applications
- Protecting stored reports
- Following retention procedures
- Keeping payment data out of unsecured notes
Payment-related systems should be handled according to applicable security responsibilities. The PCI Security Standards Council publishes standards and supporting material for protecting payment account data.
Restaurants should seek qualified privacy, security, and compliance guidance for their specific systems and practices.
Daypart, Peak Hour, and Sales Trend Reports
Time-based reports show when restaurant activity occurs.
Dayparts may include breakfast, lunch, afternoon, dinner, happy hour, late night, or custom periods. Hourly and half-hourly reports provide a more detailed view of demand.
These restaurant performance reports may show:
- Sales by hour
- Orders by time interval
- Average ticket by daypart
- Menu mix by daypart
- Labor hours by period
- Table turnover
- Payment activity
- Online order volume
- Discounts and refunds by time
- Weekday and weekend patterns
Trend reports are more useful when similar periods are compared. A Friday dinner should generally be compared with other Friday dinners rather than a Monday lunch.
Using Peak Hour Reports for Staffing
Peak-hour reporting helps managers understand when order volume rises and how quickly it changes.
A restaurant may need preparation staff before sales reach their peak, not only during the highest-volume interval. Similarly, employees may need time after the rush for cleaning, restocking, and closing tasks.
Managers can compare hourly sales with:
- Employees on the clock
- Orders per labor hour
- Ticket times
- Table turnover
- Customer wait times
- Online order volume
- Kitchen capacity
The objective is balanced staffing. Reducing hours without considering workload can harm service, order accuracy, and employee well-being.
Using Daypart Reports for Menu Planning
Menu demand often changes throughout the day.
Breakfast guests may favor fast, portable items, while dinner customers may order more appetizers, beverages, and desserts. Late-night demand may concentrate on a smaller menu.
Daypart reporting can guide:
- Preparation quantities
- Menu availability
- Specials
- Ingredient staging
- Staffing by station
- Online order limits
- Pricing review
- Promotional timing
Operators should monitor results after making changes. A reduced late-night menu may improve speed, but it could also reduce average ticket if high-value items are removed.
Inventory Reports in Restaurant POS Systems
Restaurant inventory reports help managers monitor stock levels, usage, purchasing, transfers, waste, and variance when inventory tools are connected to POS activity.
Common reports include:
- On-hand inventory
- Low-stock items
- Reorder suggestions
- Ingredient usage
- Purchase history
- Receiving activity
- Waste logs
- Theoretical versus actual usage
- Inventory value
- Location transfers
Inventory data is only as dependable as the procedures supporting it. Late receiving, inconsistent counts, incorrect units, outdated recipes, and unrecorded waste can reduce accuracy.
Physical counts remain important. POS sales estimate theoretical usage, but a count confirms what is actually available.
Low-Stock and Reorder Reports
Low-stock reports identify ingredients or supplies that have fallen below a configured threshold.
Thresholds should reflect:
- Typical usage
- Supplier lead time
- Delivery frequency
- Shelf life
- Storage capacity
- Seasonal demand
- Menu importance
- Emergency alternatives
An alert does not necessarily mean an item should be ordered immediately. A perishable ingredient may already be scheduled for delivery, or a menu change may reduce future demand.
Managers should combine low-stock reports with upcoming reservations, catering orders, promotions, and expected sales.
Waste and Spoilage Reports
Waste reports record ingredients or prepared items that cannot be sold.
Useful waste categories include:
- Spoilage
- Overproduction
- Preparation mistakes
- Dropped items
- Returned food
- Expired stock
- Quality rejection
- Equipment failure
- Incorrect portioning
Consistent reason codes help managers identify patterns. If waste repeatedly occurs during preparation, recipes or training may need attention. If spoilage rises after large deliveries, purchasing quantities may be too high.
The purpose of waste reporting is improvement, not hiding or discouraging accurate entries.
Tax, Tip, and Compliance-Related Reports
Restaurant POS systems may organize sales taxes, tips, gratuities, service charges, and payout information into separate reporting categories.
These reports can support record preparation, but the POS configuration must match the restaurant’s actual requirements and professional guidance.
Tax-related reports may separate taxable sales, non-taxable sales, exempt transactions, tax collected, refunds, and tax by location or category. Tip reports may separate cash tips, card tips, declared tips, tip-outs, tip pools, and service charges.
The IRS distinguishes voluntary tips from compulsory service charges and provides recordkeeping and reporting guidance for tipped employees and employers.
Restaurants should not rely on a general POS report as legal, tax, payroll, or accounting advice. Specific setup and reporting questions should be reviewed by qualified professionals.
Tax Reporting Categories
A POS may calculate and report tax based on:
- Menu item category
- Order type
- Location
- Customer exemption
- Service method
- Discount treatment
- Refund activity
- Delivery or service fees
Incorrect item mapping can create inaccurate reports. For example, an item may be assigned to the wrong tax category, or a new service charge may not be configured correctly.
Managers should periodically test sample transactions and compare receipts with report totals. Professional review is recommended whenever tax rules, menu categories, fees, or locations change.
Tip and Gratuity Reports
Tip reports may show:
- Card tips
- Cash tips entered or declared
- Tips by employee
- Tip-outs
- Tip-pool contributions
- Tip distributions
- Tips by payment method
- Service charges
- Adjustments and refunds
For general background on employee and employer responsibilities, operators can review the IRS guidance on tip recordkeeping and reporting. Specific tip, payroll, tax, or service-charge questions should be reviewed by a qualified professional.
These reports can support payroll preparation and internal recordkeeping, but tip and service-charge treatment can differ.
The IRS explains that cash tips include tips paid through cards and other electronic settlement methods, and it provides separate guidance for employee and employer responsibilities.
Restaurants should obtain professional payroll, tax, employment, and legal guidance for tip distribution, service charges, reporting, and record retention.
Multi-Location Restaurant Reporting
Multi-location reporting gives owners and operations teams a consolidated view of several restaurants.
A multi-location restaurant reporting dashboard may compare:
- Sales
- Order volume
- Average ticket
- Menu mix
- Labor percentage
- Inventory usage
- Discounts and refunds
- Payment activity
- Customer behavior
- Daypart trends
Comparisons can highlight opportunities, but they must account for differences in size, hours, menu, local demand, pricing, and service model.
A downtown café should not automatically be judged against a suburban full-service location using only total sales. Comparable metrics such as sales per operating hour, transactions per labor hour, or category mix may provide better context.
Comparing Location Performance
Location comparisons can reveal useful questions:
- Why does one store sell more of a certain category?
- Why are labor hours higher at another location?
- Are price or menu differences affecting average ticket?
- Is one location experiencing greater inventory variance?
- Are payment or refund patterns unusual?
- Which location performs best during a specific daypart?
The objective is not simply to rank locations. High-performing locations may reveal practices that can be shared, while struggling locations may need different staffing, training, equipment, marketing, or menu support.
Standardizing Reports Across Locations
Standardization makes restaurant business reports more comparable.
Restaurants should use consistent:
- Menu item names
- Categories
- Modifier structures
- Payment types
- Discount reason codes
- Refund procedures
- Labor roles
- Daypart definitions
- Inventory units
- Reporting calendars
Without standardization, “beverages” at one location may include categories that another location reports separately.
Local differences can remain where needed, but core reporting definitions should be documented and understood by managers.
Cloud-Based POS Reporting Dashboards
Cloud-based POS reporting allows authorized users to access restaurant reports through an internet-connected platform rather than relying only on a back-office terminal.
A restaurant reporting dashboard may display live sales, order volume, labor activity, menu performance, payments, inventory indicators, and location comparisons.
Operators who want a deeper understanding of live metrics can learn how a real-time restaurant dashboard brings sales, labor, inventory, customer activity, and service indicators into one centralized view.
Cloud-based reporting can support remote oversight, mobile access, centralized exports, and faster communication between owners and managers. However, access should be protected through secure credentials, permissions, and appropriate device practices.
Real-time information is helpful, but not every metric requires an immediate response. Managers should distinguish urgent operational alerts from ordinary fluctuations.
Real-Time Reporting for Managers
Real-time reporting can help managers notice:
- Unexpected sales changes
- Sudden online order volume
- Staffing gaps
- Low-stock alerts
- Payment failures
- High refund activity
- Open checks
- Unusual discounts
- Menu items becoming unavailable
Managers should define which conditions require intervention. Reacting to every small change can create unnecessary disruption.
A dashboard should support service rather than distract from it. Many restaurants benefit from scheduled checks before service, after peak periods, and during closing.
Report Access and Permissions
Not every employee needs access to every report.
Sensitive categories may include:
- Employee pay information
- Labor costs
- Customer profiles
- Payment reports
- Refund controls
- Sales totals
- Multi-location performance
- Export functions
Role-based permissions can give employees access to the functions required for their jobs while protecting business and customer information.
Access should be reviewed when employees change roles or leave the business. Shared accounts should be avoided because they make activity harder to trace.
Common Restaurant POS Reporting Mistakes
Restaurant POS reporting can become unreliable when operators ignore reports, rely on isolated metrics, or fail to maintain accurate data.
Common mistakes include:
- Reviewing only total sales
- Skipping payment reconciliation
- Ignoring discounts and refunds
- Comparing unrelated periods
- Using inconsistent menu categories
- Failing to record waste
- Allowing shared employee logins
- Keeping outdated permissions
- Exporting reports without protecting them
- Making decisions from one unusual day
- Failing to document operational events
- Collecting reports without taking action
Good reporting requires a repeatable process. Managers should know which reports they own, when to review them, and what requires follow-up.
Reviewing Reports Without Taking Action
Reports have limited value when they are repeatedly opened but never used.
A reporting review should end with one of three outcomes:
- No action is needed.
- More investigation is required.
- A specific change will be made and monitored.
For example, a rise in waste might lead to a recipe review, additional training, a smaller prep batch, or a change in ordering quantity. A labor variance may require schedule adjustments or further review of closing duties.
Actions should be documented so managers can later assess whether they helped.
Poor Data Setup in the POS
Incorrect configuration can make polished dashboards misleading.
Common setup issues include:
- Duplicate menu items
- Wrong prices
- Inconsistent categories
- Incorrect tax settings
- Unmapped modifiers
- Outdated employee roles
- Incorrect payment types
- Missing recipes
- Inconsistent location names
- Generic adjustment codes
Restaurants should review setup after menu changes, pricing updates, new order channels, location openings, or policy changes.
Restaurant POS Reporting Checklist
| Report Area | What to Review | How Often | Why It Matters |
| Daily sales | Gross, net, taxes, tips, orders | Daily | Tracks performance |
| Payments | Cash, cards, batches, deposits | Daily | Supports reconciliation |
| Cash drawers | Starting, expected, actual cash | Daily | Identifies discrepancies |
| Adjustments | Discounts, comps, voids, refunds | Daily or weekly | Supports controls |
| Menu items | Top and low sellers | Weekly | Improves menu planning |
| Labor | Scheduled and actual hours | Weekly | Helps scheduling |
| Inventory | Stock, usage, variance, waste | Weekly | Supports food cost control |
| Customers | Visits and order trends | Monthly | Supports relevant outreach |
| Multi-location | Comparable store metrics | Monthly | Shows location performance |
| Dashboard KPIs | Selected operating measures | Daily or weekly | Guides decisions |
How to Use the Checklist
Assign responsibility for each report.
A closing manager might own the daily sales, payment, cash drawer, and adjustment reviews. A kitchen manager may review waste and ingredient usage. A general manager may review labor, menu performance, and weekly trends.
Keep the routine manageable. A long checklist that is rarely completed is less useful than a focused process that managers follow consistently.
Document exceptions, actions, and unresolved questions. This creates continuity between shifts and helps owners understand why results changed.
Records to Keep With POS Reports
Supporting records may include:
- Sales summaries
- Card batch reports
- Cash count sheets
- Deposit records
- Refund documentation
- Inventory counts
- Receiving records
- Waste logs
- Labor and time records
- Manager notes
- Adjustment approvals
- Settlement reports
Retention requirements vary by record type and jurisdiction. Restaurants should obtain professional guidance on how long to keep tax, payroll, employment, accounting, payment, and compliance records.
Best Practices for Restaurant POS Reporting
Effective restaurant POS reporting is consistent, focused, and connected to decisions.
Recommended practices include:
- Review daily sales reports consistently.
- Reconcile payment reports with supporting deposits.
- Check discounts, comps, voids, and refunds.
- Review menu item performance weekly.
- Compare labor reports with schedules.
- Use inventory reports to investigate food cost.
- Review peak-hour trends before scheduling.
- Standardize menu and adjustment categories.
- Train managers on report definitions.
- Protect reports through permissions.
- Export records only when necessary.
- Compare trends over time.
- Document unusual events.
- Use reports to ask specific questions.
- Seek professional advice for tax, payroll, accounting, employment, legal, and compliance matters.
Reporting should not become an administrative burden that takes managers away from operations. The process should concentrate on the metrics that lead to useful action.
Creating a Restaurant Reporting Routine
A practical routine may look like this:
Daily
- Sales summary
- Payment reconciliation
- Cash drawer count
- Open checks
- Discounts, comps, voids, and refunds
- Manager notes
Weekly
- Menu item performance
- Labor versus schedule
- Inventory usage and variance
- Waste
- Daypart trends
- Employee training indicators
Monthly
- Customer trends
- Multi-location comparison
- Category performance
- Average ticket trends
- Promotion review
- Permission and setup checks
Managers should use the same report definitions and review periods so comparisons remain consistent.
Turning Reports Into Action
A useful report should lead to a decision, test, or documented conclusion.
Examples include:
- Increasing prep for a consistently strong menu item
- Reducing an order quantity after repeated spoilage
- Adding coverage before a recurring rush
- Revising a confusing discount button
- Coaching employees on payment procedures
- Investigating a location’s refund pattern
- Adjusting menu availability by daypart
- Testing a different item placement
- Updating reorder thresholds
Changes should be measured after implementation. Otherwise, teams may not know whether the action improved results.
How to Choose Restaurant Reporting Software or POS Reporting Tools
Restaurant reporting software should make information understandable and useful. A long feature list does not guarantee that managers can find the reports they need.
Before choosing restaurant analytics software, operators should evaluate sales reporting, payment reconciliation, labor reports, inventory reporting, menu analytics, dashboard customization, customer reporting, multi-location access, exports, permissions, integrations, and support.
The system should fit the restaurant’s service model. A food truck may need simple mobile reporting and event comparisons, while a restaurant group may require consolidated dashboards, standardized categories, and location-level permissions.
Restaurants should request demonstrations using realistic workflows. Ask to see a completed daily close, refund investigation, labor comparison, menu item report, and payment reconciliation rather than only a general dashboard.
Questions to Ask Before Choosing Reporting Tools
Useful questions include:
- What is included in the daily sales report?
- How are gross and net sales defined?
- Can reports separate order channels?
- How are refunds, voids, discounts, and comps shown?
- Can card totals be matched with batches and deposits?
- Are cash drawer reports available by employee or shift?
- Can labor reports compare scheduled and actual hours?
- Does inventory reporting support recipes and variance?
- Can menu items be analyzed by daypart and location?
- Are customer profiles and loyalty reports permission-controlled?
- Can dashboards be customized by role?
- Are multi-location reports standardized?
- Can reports be exported in usable formats?
- Which integrations are supported?
- How are data backups and access handled?
- What training and support are available?
- What is the total cost of reporting features and integrations?
Answers should be documented and tested before implementation.
Comparing Reporting Clarity Over Feature Count
A reporting tool is useful only when managers understand it.
Prioritize:
- Clear definitions
- Accurate calculations
- Logical navigation
- Reliable filters
- Consistent date ranges
- Useful exports
- Role-based access
- Workflow fit
- Actionable detail
- Dependable support
A simple POS reporting dashboard that managers use every day may provide more value than a complex analytics platform they avoid.
The best choice is the tool that turns accurate restaurant data into understandable questions, timely reviews, and practical operational decisions.
Frequently Asked Questions
What is restaurant POS reporting?
Restaurant POS reporting is the process of organizing and reviewing data captured by a restaurant’s point of sale system. Reports may cover sales, payments, menu items, employees, labor hours, tips, taxes, inventory, discounts, refunds, customers, dayparts, and locations.
The reports help owners and managers understand what happened during a shift or reporting period and identify areas that may require action.
What are the most important restaurant POS reports?
The most important reports usually include the daily sales report, payment report, cash drawer report, menu item report, labor report, inventory report, adjustment report, refund report, and daypart report.
Multi-location businesses may also need location comparison and consolidated dashboard reports. Priorities depend on the restaurant’s service model, size, menu, payment channels, and operational goals.
How does POS reporting for restaurants help with sales tracking?
POS sales reporting records sales by date, time, menu item, category, employee, order channel, payment method, and location. Managers can compare gross sales, net sales, order volume, average ticket, guest count, discounts, and refunds.
This makes it easier to identify trends and understand whether a change comes from more orders, higher spending, menu mix, pricing, or adjustments.
Can restaurant POS analytics help control food and labor costs?
Yes. POS analytics can support cost control by connecting menu sales with ingredient usage, inventory counts, labor hours, and schedules. Recipe mapping can estimate expected ingredient usage, while labor reports can compare scheduled and actual hours with sales activity.
These reports provide operational indicators. Specific accounting, payroll, tax, employment, or financial decisions should be reviewed with qualified professionals.
What should managers review in daily POS reports?
Managers should usually review gross and net sales, order volume, average ticket, taxes, tips, payment totals, cash drawer activity, discounts, comps, voids, refunds, open checks, and unusual transactions.
They should also document events that affected the day, such as promotions, equipment problems, large groups, weather, staffing shortages, or unavailable menu items.
How do restaurant payment reports support reconciliation?
Payment reports separate transactions by tender type, such as cash, cards, digital wallets, gift cards, and online payments.
Managers can compare those totals with cash counts, card batches, settlement reports, and bank deposits. Differences may result from batch timing, fees, refunds, chargebacks, adjustments, or incorrect payment selection.
Why are menu item reports important?
Menu item reports show which products sell, when they sell, how much revenue they generate, and which modifiers guests select. They help managers identify best sellers, investigate low-performing items, plan preparation, protect ingredient availability, and evaluate menu changes.
Menu sales should also be reviewed with ingredient cost, waste, preparation complexity, and guest feedback.
What should restaurants look for in restaurant reporting software?
Restaurants should look for accurate sales reports, clear payment reconciliation, labor comparisons, inventory visibility, menu analytics, customer reporting, daypart analysis, secure permissions, exports, integrations, and multi-location support where needed.
Reporting clarity and workflow fit are more important than having the greatest number of features. Managers should test the software with real operating scenarios before making a decision.
Conclusion
Restaurant POS reporting gives operators a structured view of sales, payments, labor, inventory, menu performance, customer trends, and daily operations.
Daily sales reports show what was sold. Payment and cash drawer reports support reconciliation. Menu reports reveal product demand, while inventory reports connect sales with ingredient movement. Labor reports help managers compare staffing with business volume, and customer reports provide insight into visit and order patterns.
The greatest value comes from using these reports together. Strong sales may look different after reviewing discounts, labor hours, refunds, and food waste. A popular menu item may require changes if it creates excessive preparation time or inventory variance.
Restaurants should establish consistent daily, weekly, and monthly reporting routines. Managers should reconcile payments, review adjustments, monitor food and labor indicators, maintain accurate POS data, document unusual events, and protect access to sensitive reports.
They should also use employee and customer information responsibly. Reports should support fair investigation, useful coaching, and informed operational decisions—not conclusions based on isolated numbers.
The right restaurant POS reporting process does not require managers to study every metric. It requires dependable data, clear report definitions, regular review, and a willingness to turn findings into practical action.
When restaurant teams understand what their reports show—and what they do not show—they can manage schedules, purchasing, menu decisions, payment activity, service flow, and operational efficiency with greater clarity.