
Food costs can change quickly. A supplier may raise the price of cooking oil, protein portions may become inconsistent, produce may spoil before it is used, or staff may prepare more food than customer demand requires.
Each issue may appear small during a busy shift. Together, however, they can reduce gross margin, create inventory shortages, increase waste, and make profitable menu items look less successful than they actually are.
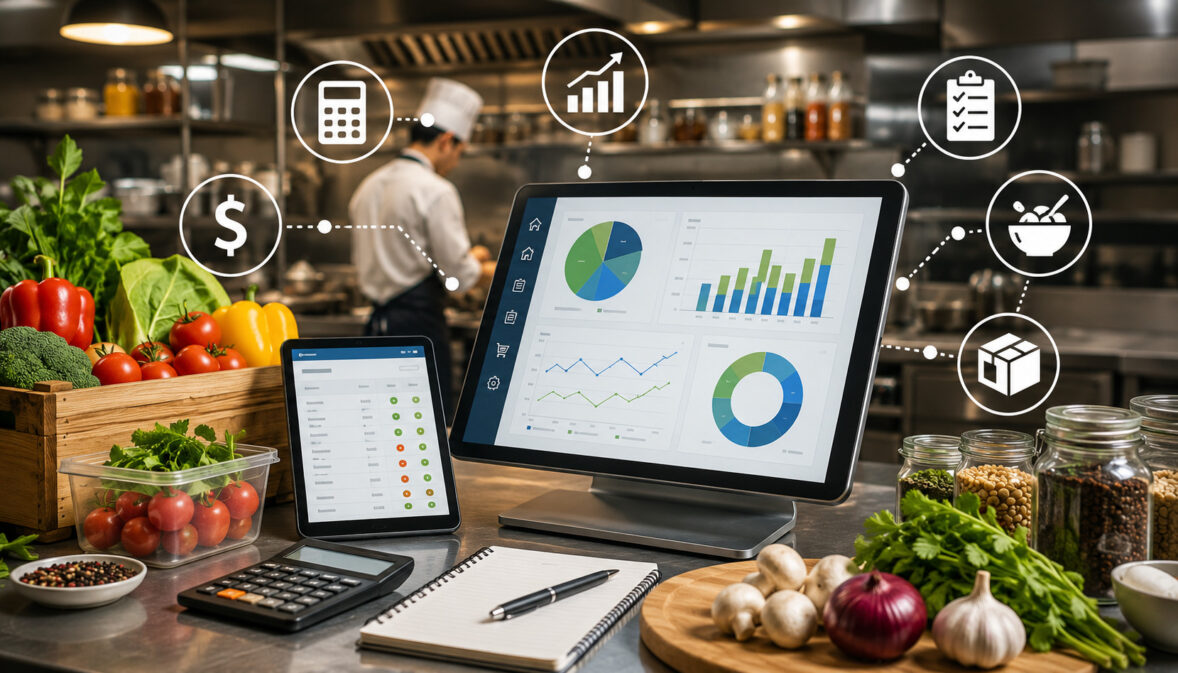
Tracking food costs with restaurant software gives operators a more organized way to understand what happens between purchasing ingredients and selling finished dishes. It connects ingredient prices, recipes, inventory counts, sales data, purchase records, waste logs, and operational reports.
This connection matters for many types of food-service businesses:
- Full-service restaurants with large menus and several storage areas
- Cafés that use shared ingredients across drinks and food items
- Bars that must monitor pours, garnishes, mixers, and bottle inventory
- Quick-service restaurants handling high transaction volumes
- Food trucks working with limited storage and narrow par levels
- Multi-location operations that need consistent recipes and count procedures
- Independent operators that want better visibility without complicated spreadsheets
Restaurant software does not eliminate the need for accurate receiving, portion control, physical inventory counts, or kitchen training. It makes those activities easier to organize and turns the collected information into reports managers can use.
This guide explains how restaurant food cost tracking works, which features matter, how software connects sales to ingredient usage, and how operators can use the resulting data to improve purchasing, waste control, recipe consistency, and menu profitability.
What Does Tracking Food Costs with Restaurant Software Mean?
Tracking food costs with restaurant software means using a connected digital system to record, calculate, and review the cost of ingredients used to prepare and sell menu items.
The system may combine supplier prices, invoice details, recipe quantities, inventory counts, sales transactions, purchase orders, waste records, and menu data. Instead of reviewing these records separately, managers can examine how they affect one another.
For example, a restaurant may purchase a case of chicken breasts, record the pack size and cost, assign a standard portion to several recipes, and map those recipes to items in the POS. As the menu items sell, the software estimates how much chicken should have been used.
A physical inventory count then shows how much chicken remains. Comparing expected stock with counted stock can reveal over-portioning, spoilage, receiving errors, unrecorded waste, incorrect recipe mapping, or count mistakes.
This is the practical purpose of food cost management software: turning separate operational activities into a connected view of ingredient movement and cost.
Restaurant operators who want to understand how purchasing, recipe usage, physical counts, waste, and POS sales work together can read this guide to restaurant inventory management.
What Restaurant Food Cost Tracking Shows
Restaurant food cost tracking shows where ingredient spending occurs and whether actual kitchen usage matches planned usage.
Depending on the software and data entered, managers may be able to review:
- Current ingredient costs
- Cost per recipe or portion
- Food cost percentage
- Beginning and ending inventory
- Cost of goods sold
- Theoretical food cost
- Actual food cost
- Inventory variance
- Waste by item, reason, or employee
- Vendor purchase history
- Supplier price changes
- Menu item contribution margin
- Low-stock items
- Inventory valuation
- Expected ingredient usage based on sales
These reports help managers move beyond total purchasing figures. A high weekly food bill does not necessarily indicate a problem if sales increased proportionately. Similarly, stable purchasing may hide excess waste if sales declined or inventory was depleted.
Useful restaurant food cost software provides context. It helps managers understand not only how much was spent, but also what was purchased, what should have been used, what was sold, what remains in stock, and where unexplained differences appeared.
Why Software Helps More Than Manual Spreadsheets
Spreadsheets can support basic restaurant food cost tracking, especially for a small menu. Their limitations become more noticeable as transaction volume, recipe complexity, supplier activity, and the number of locations increase.
Manual spreadsheets often require managers to copy information from invoices, POS reports, inventory sheets, and waste logs. Duplicate entry consumes time and increases the risk of inconsistent item names, outdated prices, incorrect formulas, and missing records.
Software can automate or simplify several parts of the process. POS sales may flow into food cost reports, invoice information may update ingredient prices, and mobile count sheets may replace handwritten inventory forms.
A connected system can also produce reports faster. Instead of building a new spreadsheet each week, managers can review dashboards, variance reports, recipe costs, and purchasing trends based on current records.
Why Food Cost Tracking Matters for Restaurants
Food is one of the most active cost areas in restaurant operations. Ingredient quantities change daily, prices move throughout the year, and perishable products can lose value quickly.
Food cost tracking matters because managers cannot control a cost they cannot clearly see. Total sales alone do not show whether a restaurant is purchasing efficiently, following recipes, controlling portions, or using inventory before it expires.
A reliable tracking process supports:
- More informed purchasing decisions
- Better menu pricing reviews
- Consistent recipe execution
- Reduced over-ordering
- Faster identification of vendor price increases
- Improved portion control
- Lower spoilage and prep waste
- Better menu engineering
- More accurate inventory valuation
- Stronger communication between managers and kitchen teams
Tracking also supports operational efficiency. A restaurant with reliable par levels and usage data can order closer to expected demand, reduce emergency purchases, and avoid tying up storage space with excess inventory.
Food cost information is operational guidance rather than a substitute for accounting, tax, legal, employment, or compliance advice. Questions in those areas should be reviewed with an appropriately qualified professional.
Food Costs and Restaurant Profitability
Food costs directly affect the amount remaining from menu sales after ingredient expenses are considered. When ingredient costs rise but menu prices and portions remain unchanged, the margin on each sale generally becomes smaller.
Consider a menu item selling for $16. If its ingredient cost rises from $4.80 to $5.60, its food cost percentage moves from 30% to 35%. That difference may seem modest on a single plate, but it becomes meaningful when the item sells hundreds of times.
Profitability can also decline without a vendor price increase. Over-portioning, trim loss, unrecorded comps, spoilage, preparation mistakes, and inaccurate inventory receiving can all increase the real cost of serving an item.
Restaurant cost control is therefore not simply about buying cheaper ingredients. It is about understanding yield, portion size, purchasing, waste, recipe accuracy, and sales mix.
Good tracking helps operators determine whether a cost increase comes from the supplier, the recipe, the kitchen process, customer demand, or the inventory records.
Why Food Cost Problems Are Often Hidden
Food cost problems rarely announce themselves during service. A slightly oversized portion may still look acceptable. A delivery shortage may go unnoticed when receiving is rushed. A pan of overproduced food may be discarded without entering a waste log.
The financial effect appears later, often as a higher cost of goods sold or unexplained inventory variance.
These problems remain hidden when sales reports, invoices, inventory counts, and waste records are reviewed separately. A POS report may show strong sales while the inventory report shows unusually high ingredient usage. Neither report explains the issue alone.
Combining records can reveal patterns. If theoretical usage suggests that 40 pounds of an ingredient should have been consumed but inventory movement indicates 52 pounds, managers have a specific variance to investigate.
The cause may be over-portioning, incorrect yield, an inaccurate recipe, staff meals, unrecorded waste, or a counting error. Software narrows the investigation so managers can focus on the process rather than searching through disconnected records.
Food Cost Tracking Software Features Compared
The best restaurant software for tracking food costs is not necessarily the platform with the longest feature list. It is the one that supports the restaurant’s actual workflow and produces information managers can maintain and understand.
The following table compares common capabilities.
| Feature | What It Tracks | Why It Matters | Best Use Case |
| Recipe costing | Ingredient cost per menu item | Shows estimated menu profitability | Menu pricing reviews |
| Inventory counts | Actual stock on hand | Identifies inventory variance | Weekly inventory review |
| POS integration | Sales connected to expected ingredient usage | Estimates stock movement | High-volume restaurants |
| Vendor price tracking | Changes in supplier costs | Reveals rising input costs | Purchasing decisions |
| Purchase orders | Ordered items and quantities | Organizes buying and approvals | Vendor management |
| Invoice matching | Invoice prices and delivered quantities | Confirms actual purchase costs | Cost accuracy |
| Waste tracking | Spoilage, mistakes, overproduction, and comps | Identifies hidden losses | Kitchen control |
| Par levels | Target quantity for each item | Reduces over-ordering and shortages | Inventory planning |
| Low-stock alerts | Items approaching reorder levels | Helps prevent stockouts | Prep and purchasing |
| Food cost reports | Cost trends, percentages, and variance | Supports management review | Owner and manager reporting |
| Menu profitability | Cost, selling price, popularity, and margin | Supports menu engineering | Menu optimization |
| Multi-location dashboards | Cost and inventory performance by site | Makes comparisons more consistent | Restaurant groups |
How to Use the Table When Comparing Tools
Begin by identifying the restaurant’s most important operational problem. A food truck may prioritize mobile inventory counts and low-stock alerts, while a multi-location restaurant group may need standardized recipes, location comparisons, and permission controls.
Next, consider how data will enter the system. Recipe costing is useful only when ingredient quantities and supplier prices remain current. POS integration is useful only when menu items, modifiers, and recipes are mapped correctly.
Managers should also assess staff capacity. A highly detailed platform may produce excellent reports, but it will not help if employees find receiving, waste entry, or inventory counts too difficult to complete consistently.
Choose a tool that supports the current workflow while leaving enough room for growth. A short pilot using representative recipes, vendors, and inventory categories can reveal usability issues before a full rollout.
Why Feature Fit Matters More Than Feature Count
Unused features do not improve food cost control. They may instead add training requirements, setup work, and subscription expense.
A café with a focused menu may need dependable recipe costing, vendor price updates, and weekly inventory reports. It may not need advanced production forecasting or complex transfer workflows.
A restaurant group with several locations may have very different requirements. It may need centralized item records, location-specific vendor pricing, transfer tracking, standardized count sheets, and consolidated dashboard analytics.
Feature fit should be evaluated against real activities:
- How ingredients are received
- How recipes are prepared
- How inventory is counted
- How waste is recorded
- How menu items and modifiers are sold
- How managers review reports
- How purchasing decisions are approved
The goal is not to collect the largest possible amount of data. It is to collect reliable data that leads to useful action.
Understanding Food Cost Percentage
Food cost percentage compares food-related cost with the sales generated from food.
A basic recipe-level calculation is:
Food cost percentage = Ingredient cost ÷ Menu selling price × 100
If a menu item costs $4.50 to prepare and sells for $15, its estimated food cost percentage is 30%.
An operating food cost calculation may use cost of goods sold:
COGS = Beginning inventory + Purchases − Ending inventory
Actual food cost percentage = COGS ÷ Food sales × 100
These calculations answer different questions. Recipe-level food cost helps evaluate a particular item. Actual food cost percentage evaluates broader performance during a reporting period.
Neither number should be treated as a complete measure of profitability. Labor requirements, preparation time, packaging, discounts, waste, payment costs, and other operating expenses also affect the value of a menu item.
Actual Food Cost vs. Theoretical Food Cost
Actual food cost is based on real inventory and purchasing activity. It reflects what the restaurant appears to have consumed during a period, including recorded and unrecorded losses.
Theoretical food cost estimates what food cost should have been based on recipe standards and actual sales. If the POS records 100 sales of a dish and the recipe requires eight ounces of protein, theoretical usage is calculated from that standard.
The difference between the two is often called food cost variance.
A wide variance does not automatically indicate theft or carelessness. It may result from:
- Incorrect recipe quantities
- Poor yield assumptions
- Over-portioning
- Unrecorded waste
- Invoice entry errors
- Receiving shortages
- Menu mapping problems
- Inventory count errors
- Ingredient substitutions
- Complimentary items not entered correctly
Comparing actual and theoretical food cost gives managers a starting point for investigation. It should lead to questions about process, setup, and training rather than immediate conclusions.
Why Food Cost Percentage Should Be Reviewed in Context
There is no single food cost percentage that suits every restaurant. Results vary according to menu type, service model, portion size, ingredient quality, beverage mix, local purchasing conditions, and pricing strategy.
A steak dish may have a higher food cost percentage than a pasta dish but still generate a larger contribution margin in dollars. A low-cost side dish may have an attractive percentage but contribute little total margin if it sells infrequently.
Seasonality also matters. Produce prices may rise, seafood availability may change, and promotional menus may temporarily shift the sales mix.
Managers should therefore compare food cost percentage with:
- Contribution margin
- Item popularity
- Waste levels
- Preparation complexity
- Sales volume
- Vendor price trends
- Menu category
- Guest expectations
- Historical performance
How Restaurant Software Tracks Ingredient Costs
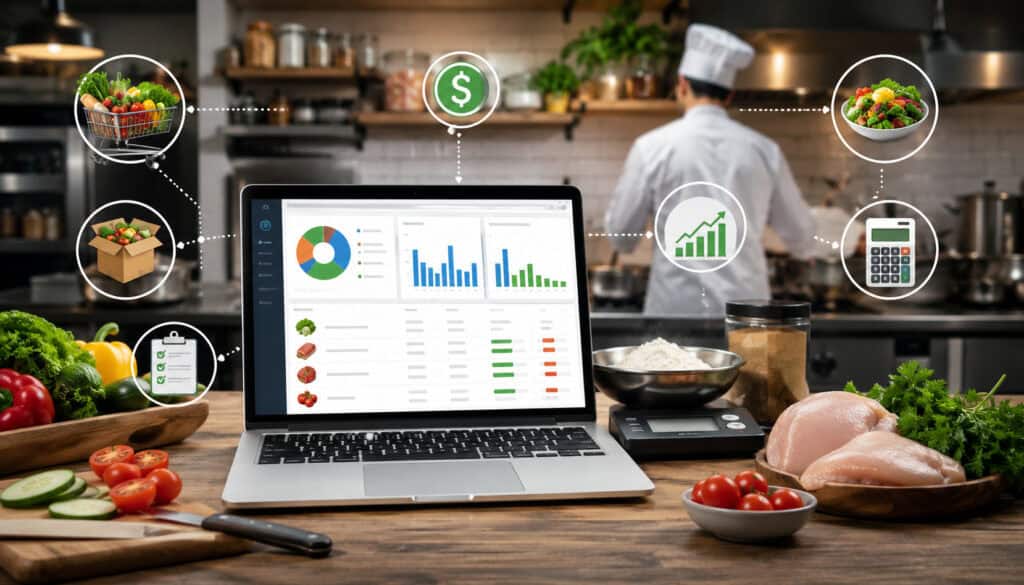
Ingredient tracking software creates a record for each purchased item. That record may include the product name, category, vendor, pack size, unit of measure, purchase price, storage area, par level, and recipe usage.
For example, a restaurant might purchase tomato sauce by the case, store it by the can, and use it by the ounce. The software must understand these relationships before it can calculate recipe costs accurately.
When a new invoice is entered or imported, the latest purchase cost may update the ingredient record. Recipes using that ingredient can then be recalculated to reflect the new price.
This process allows managers to see how vendor changes affect individual dishes. A price increase in cheese may affect pizzas, sandwiches, salads, appetizers, and prep recipes at the same time.
Reliable restaurant inventory software should help organize ingredient movement from receiving through storage, preparation, service, and waste review.
Ingredient-Level Tracking
Tracking only finished menu items provides limited insight. A restaurant may know that a sandwich category has become more expensive without knowing whether the cause is protein, bread, cheese, produce, sauce, or packaging.
Ingredient-level tracking identifies the specific cost driver. It also shows where one ingredient affects multiple menu items.
Shared ingredients are especially important. A single preparation, such as roasted vegetables or house sauce, may be used in several entrées, sides, and specials. If its yield or cost is wrong, every linked recipe may be inaccurate.
Ingredient-level records also support better ordering. Managers can review total usage across all recipes rather than estimating demand from one menu item at a time.
To keep these records usable, restaurants should use consistent naming. Duplicate entries such as “mozzarella,” “mozz cheese,” and “cheese—mozzarella” can divide purchasing and usage history across several records.
Units of Measure and Conversion Accuracy
Units of measure are among the most common sources of food cost errors.
An ingredient may be:
- Purchased by the case
- Received as individual containers
- Counted by container
- Used by ounce
- Listed in a recipe by cup
- Wasted by pound
The software needs accurate conversions between each unit. If a case contains six five-pound bags, the system should recognize that the case contains 30 pounds. If a recipe uses eight ounces, it should deduct half a pound.
Yield adds another layer. A 50-pound case of untrimmed produce may not produce 50 pounds of usable portions. Cleaning, trimming, peeling, and cooking may reduce usable yield.
Operators should test conversions with real kitchen measurements rather than relying entirely on packaging assumptions.
Recipe Costing with Restaurant Software
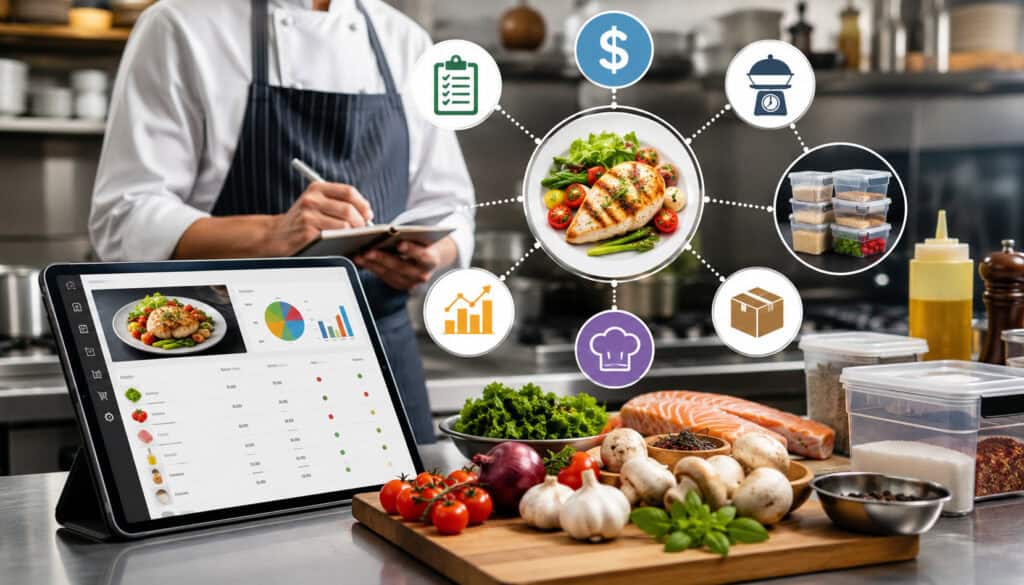
Recipe costing software calculates the expected ingredient cost of preparing a menu item, batch recipe, component, or portion.
A complete recipe may include direct ingredients, nested prep recipes, garnishes, sauces, sides, packaging, and customer-selected modifiers. The calculated cost changes when ingredient prices or recipe quantities change.
Batch recipes are particularly important. A restaurant may prepare a gallon of soup, a tray of sauce, or a large quantity of dough. The system calculates the batch cost and divides it by the expected yield.
If a batch costs $48 and produces 24 portions, the expected cost per portion is $2. If the actual yield is only 20 portions, the real portion cost is higher.
Recipe costing turns preparation standards into measurable cost expectations. It also gives chefs and managers a shared reference when portions, ingredients, or plating standards change.
Building Accurate Recipe Cards
An accurate recipe card should contain more than a list of ingredients. It should describe how the recipe becomes a consistent sellable portion.
Useful recipe card fields include:
- Ingredient names
- Exact quantities
- Purchase and recipe units
- Preparation instructions
- Trim or cooking yield
- Batch yield
- Standard portion size
- Garnishes
- Included sides
- Packaging
- Modifier options
- Substitution rules
- Current ingredient costs
- Date of the last review
Prep recipes should be linked to finished dishes. If a house dressing is used in four salads and two appetizers, its cost should flow into each menu item automatically.
Recipe cards should also match actual kitchen practice. A mathematically precise recipe is not useful if cooks use different utensils, portions, or preparation methods during service.
Using Recipe Costs for Menu Pricing
Recipe costs help managers evaluate whether menu prices still support the intended margin.
Suppose a dish costs $5.25 to prepare and sells for $17. A price increase in two ingredients raises its recipe cost to $6.10. The existing selling price may still be appropriate, but the change deserves review.
Managers may consider several responses:
- Negotiate or compare vendor pricing
- Adjust portion size carefully
- Improve ingredient yield
- Reduce avoidable garnish cost
- Revise the recipe
- Change the selling price
- Reposition the item on the menu
- Remove a low-value component
- Replace an ingredient without weakening the guest experience
Recipe cost reports should support judgment rather than automatic pricing changes. Customer expectations, competitive positioning, demand, preparation effort, and contribution margin all matter.
POS Integration and Food Cost Tracking
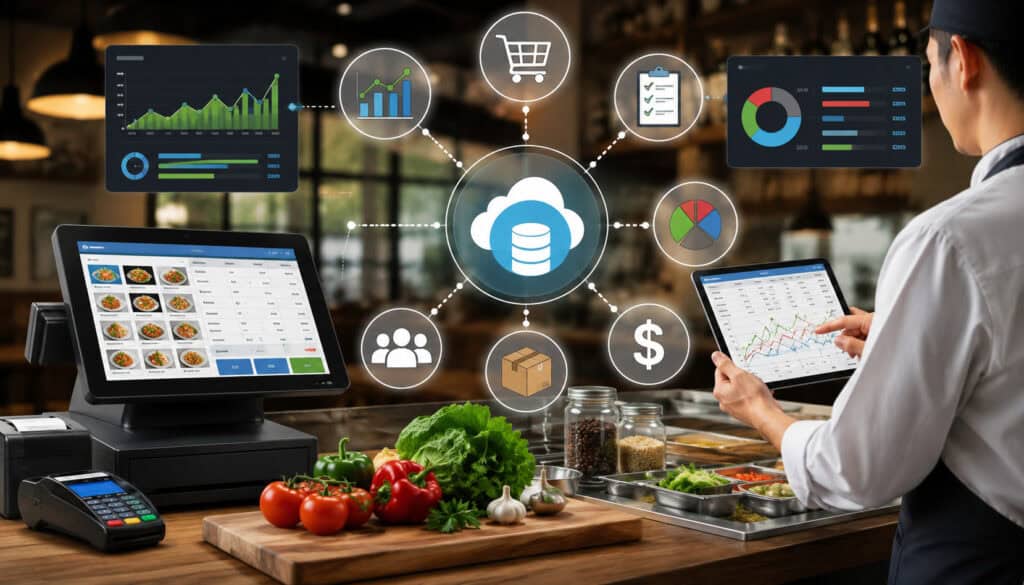
Restaurant POS integration connects what customers order with what the kitchen is expected to use.
When a mapped menu item sells, the food cost system applies its recipe and estimates ingredient consumption. A burger sale might reduce expected inventory for the patty, bun, cheese, sauce, vegetables, side, and packaging.
Modifiers must also be included. Adding cheese, removing a side, selecting a premium protein, or choosing a larger size changes expected usage.
Operators who need a broader explanation of connected sales and operational data can review this guide to integrating POS with restaurant management software.
Connecting Sales to Inventory Usage
POS-linked ingredient deductions create perpetual or estimated inventory movement. This gives managers a working view of stock between physical counts.
For example, if 60 portions of salmon are available and the POS records 38 mapped salmon dishes, the software may estimate that 22 portions remain. Recorded waste and new deliveries adjust the estimate.
This does not replace physical counting. Portions may be larger than the standard, staff may substitute ingredients, and waste may go unrecorded. The estimate is a theoretical position based on recorded activity.
The value comes from comparison. When expected inventory and counted inventory differ, managers can investigate specific ingredients and periods.
This process is especially useful for high-cost proteins, beverages, cooking oil, dairy products, and ingredients used across several menu categories.
Why Menu Mapping Must Be Accurate
Menu mapping tells the software which recipe belongs to each POS item. Incorrect mapping produces unreliable inventory usage and misleading food cost reports.
Common mapping issues include:
- Duplicate POS buttons
- Seasonal items linked to old recipes
- Combo meals missing sides or drinks
- Modifiers not assigned ingredient costs
- Multiple sizes using the same recipe quantity
- Online ordering items not connected
- Complimentary items excluded from usage
- Menu renames creating unmatched records
- Prep recipes omitted from finished dishes
Restaurants should review mapping whenever the menu changes. New specials, price changes, modifiers, delivery menus, and limited-time offers may create new item identifiers.
Inventory Counts and Stock Control
Physical inventory counts establish what the restaurant actually has on hand. They are essential for calculating cost of goods sold and evaluating variance.
A count process normally covers storage areas such as:
- Walk-in coolers
- Freezers
- Dry storage
- Prep stations
- Bar storage
- Service lines
- Beverage coolers
- Off-site storage
- Food truck or catering vehicles
Items should appear in a practical count order that follows the physical layout. This reduces backtracking and lowers the chance that products are counted twice or skipped.
Count timing should also remain consistent. Counting after close one week and during active preparation the next can make comparisons unreliable because ingredients are moving while staff count.
How Software Improves Inventory Counts
Digital count sheets can organize items by storage area, category, shelf order, or assigned employee. Mobile tools allow staff to enter quantities while moving through the kitchen.
Software may also display the last count, pack size, count unit, and recent purchase price. These references help counters identify unusual entries before submitting the count.
Other useful capabilities include:
- Barcode scanning
- Multiple count units
- Saved count templates
- Blind counts
- Variance flags
- Count approvals
- Inventory valuation
- Location-specific lists
- Notes and photo attachments
Digital counts reduce transcription because managers do not need to copy handwritten numbers into a spreadsheet. They also create a history that can be compared over time.
However, technology cannot determine whether an open container is half full or whether two employees counted the same shelf. Training and clear procedures remain necessary.
Inventory Variance Review
Inventory variance is the difference between expected inventory and physically counted inventory.
A negative variance means less inventory was counted than expected. Possible causes include over-portioning, spoilage, theft, unrecorded waste, missed transfers, receiving shortages, recipe errors, or count mistakes.
A positive variance means more stock was counted than expected. This may indicate an understated delivery, duplicate recipe deduction, an incorrect pack conversion, missing sales data, or a previous counting error.
Managers should prioritize high-value and high-variance items rather than treating every difference equally. A small percentage variance in an expensive protein may matter more than a large percentage variance in a low-cost garnish.
Variance reports are most useful when followed by operational review. The goal is to improve the process that created the difference.
Vendor Pricing and Purchase Tracking
Supplier prices determine the starting cost of ingredients. Restaurant software can store vendor records, item catalogs, purchase orders, delivery quantities, invoice prices, credits, and price history.
This information allows managers to compare current costs with previous purchases. It can also show when the same ingredient is purchased from multiple vendors at different pack sizes or prices.
Purchasing reports should account for more than the invoice total. Delivery fees, substitutions, pack-size changes, credits, and minimum-order requirements may affect the practical cost of an item.
A restaurant may also receive products under slightly different descriptions. Item mapping should connect vendor descriptions to the correct internal ingredient record.
Tracking Vendor Price Changes
Vendor price tracking helps explain why recipe costs change even when portions and sales remain stable.
Managers can review:
- Current and previous unit cost
- Percentage price change
- Price by supplier
- Frequency of increases
- Pack-size changes
- Substitute products
- Purchase volume
- Contract or promotional pricing
- Credits and shortages
Price history can identify ingredients that require a menu review or sourcing discussion. It may also reveal that a lower case price is not actually less expensive when the pack size or usable yield is considered.
Price alerts should be reviewed rather than accepted automatically. An unusual increase may result from an entry error, unit mismatch, temporary substitute, or incorrect invoice mapping.
Purchase Orders and Receiving
Purchase orders document what the restaurant intended to buy. Receiving records document what actually arrived. Supplier invoices document what was charged.
Comparing all three can identify:
- Missing cases
- Damaged products
- Unauthorized substitutions
- Quantity differences
- Pack-size changes
- Unexpected price increases
- Duplicate charges
- Missing credits
Receiving should be completed while the delivery is present whenever practical. Staff should verify quantities, product condition, and relevant storage requirements before accepting the order.
Restaurant software can create a clearer audit trail by recording who placed the order, who received it, what changed, and whether an adjustment or credit was requested.
Food Waste and Spoilage Tracking
Food waste tracking records ingredients or prepared products that leave inventory without generating a normal sale.
Waste may include:
- Spoiled ingredients
- Expired products
- Preparation mistakes
- Burned or dropped food
- Incorrect orders
- Returned dishes
- Overproduction
- Excess trim
- Test portions
- Comped products
- Unused buffet or catering food
- Storage damage
Restaurants can learn more about using restaurant data to reduce food waste by connecting purchasing, inventory, recipe yield, sales, and waste-reason records.
A waste entry should include the item, quantity, reason, estimated cost, time, and responsible area. The purpose is not to punish employees for every mistake. It is to identify patterns that can be corrected.
Preventing avoidable waste should generally come before deciding how discarded food will be managed. The EPA’s Wasted Food Scale prioritizes prevention, donation, and upcycling over disposal methods such as landfilling or sending food down the drain.
Why Waste Logs Matter
Waste logs convert an invisible cost into measurable information.
Without a log, managers may notice that inventory is disappearing but cannot distinguish between spoilage, overproduction, preparation errors, or inaccurate recipes. A structured log shows where and why losses occur.
For example, repeated spoilage may indicate excessive par levels or poor stock rotation. Frequent returned meals may point to order-entry or preparation problems. High trim waste may indicate a yield assumption that does not match the purchased product.
Waste data can support training conversations, recipe changes, storage improvements, and purchasing adjustments.
Managers should keep waste categories limited and clear. Too many options slow entry and create inconsistent reporting. A short list of practical reasons usually produces more useful data.
Reducing Waste with Better Forecasting
Historical sales and ingredient usage can improve forecasting. Managers can review similar days, seasonal patterns, weather-sensitive demand, events, promotions, and reservation volume before setting prep quantities.
Forecasting does not need to be perfect. Its purpose is to reduce large mismatches between expected demand and production.
Software can help by comparing:
- Forecasted sales with actual sales
- Planned prep with actual usage
- Ending stock with par levels
- Waste with production quantity
- Menu item demand by daypart
- Ingredient usage by order channel
The United States Department of Agriculture provides general educational information about food loss and waste. Restaurants should apply waste-reduction practices without compromising food safety.
Portion Control and Recipe Consistency
Portion control ensures that each guest receives the intended quantity and that actual ingredient usage remains close to recipe expectations.
Common portioning tools include:
- Digital scales
- Measuring cups
- Scoops
- Ladles
- Spoodles
- Portion bags
- Slicing guides
- Bottle pour controls
- Plating photographs
- Prep labels
Consistency supports both guest experience and restaurant food cost control. A dish that varies between shifts creates unpredictable costs and may disappoint customers.
Restaurant software supports portion control indirectly by showing when actual usage exceeds theoretical usage. It does not replace kitchen observation, recipe training, or appropriate measuring tools.
How Portioning Affects Profitability
Over-portioning usually occurs in small increments. An extra ounce of protein or cheese may not look significant, but repeated across hundreds of orders it can consume several additional cases.
Under-portioning is also a problem. Although it may reduce immediate ingredient usage, it can harm consistency and guest value.
The standard portion should reflect recipe design, plate presentation, menu price, and customer expectations. Staff need practical tools that allow them to reproduce it during busy service.
Yield should be considered as well. A purchased pound is not always a usable pound after trimming, cooking, or preparation loss.
Managers should observe real production and compare it with the assumptions stored in recipe costing software. Differences often reveal that the recipe standard or yield needs revision.
Using Software Reports to Spot Portion Issues
A persistent negative variance in an ingredient used mainly for one dish may indicate portion inconsistency.
For example, theoretical usage may show that 80 pounds of a protein should have been consumed, while inventory movement indicates 92 pounds. If waste and receiving records are accurate, the 12-pound difference deserves review.
Managers can:
- Recheck the recipe quantity.
- Verify the unit conversion.
- Observe how portions are prepared.
- Weigh several actual portions.
- Review recorded waste.
- Confirm sales and modifier mapping.
- Recount the remaining stock.
This process avoids assuming that staff behavior is the only explanation. Recipe setup and inventory records should be validated before operational conclusions are made.
Menu Profitability and Menu Engineering
Menu profitability tracking combines item cost, selling price, sales volume, and contribution margin.
Food cost percentage shows the share of the selling price consumed by ingredients. Contribution margin shows the dollars remaining after the item’s ingredient cost is subtracted from its selling price.
For example:
- Item A sells for $12 and costs $3, producing a $9 contribution margin.
- Item B sells for $24 and costs $9, producing a $15 contribution margin.
Item B has a higher food cost percentage but contributes more gross margin dollars per sale.
Menu engineering evaluates both popularity and margin. It helps managers understand which items deserve promotion, adjustment, repositioning, or further investigation.
A connected restaurant reporting software workflow can bring menu performance, inventory usage, sales trends, and location-level comparisons into the same review.
Identifying High-Margin Menu Items
High-margin items are not simply the products with the lowest ingredient cost. They are items that generate strong contribution while meeting customer expectations and fitting the restaurant’s operational capacity.
Managers should review:
- Selling price
- Current recipe cost
- Contribution margin
- Number of units sold
- Preparation time
- Waste rate
- Modifier revenue
- Order channel
- Kitchen complexity
- Ingredient availability
An item may be highly profitable but difficult to produce during peak periods. Another may have a modest margin but drive beverage sales or attract repeat customers.
The strongest opportunities are often popular items with reliable production, manageable waste, and healthy contribution margin. Software helps identify these patterns, but management judgment determines how they should influence the menu.
Reviewing Low-Margin or High-Waste Items
A low-margin item does not always need to be removed. Managers may improve it by adjusting portions, changing a side, reviewing vendor options, reducing waste, revising preparation, or updating the price.
High-waste items require a separate review. The problem may come from poor demand forecasting, short shelf life, oversized batches, inconsistent preparation, or an ingredient used in too few recipes.
Possible actions include:
- Reprice the item
- Reduce the portion
- Improve batch planning
- Cross-use ingredients thoughtfully
- Simplify the recipe
- Change the garnish
- Revise the purchasing quantity
- Limit availability
- Reposition the item
- Remove it after testing alternatives
Changes should be monitored after implementation. A revised recipe or price may improve cost percentage but reduce sales volume.
Food Cost Reports Restaurant Owners Should Review
Restaurant reporting software may produce dozens of reports. Managers do not need to review all of them every day.
A focused report set is more useful than a large dashboard that nobody uses.
Core reports may include:
- Food cost percentage
- Actual versus theoretical cost
- Inventory variance
- Recipe cost changes
- Vendor price history
- Purchases by vendor
- Waste by reason
- Stock on hand
- Low-stock alerts
- Inventory valuation
- Menu item profitability
- Contribution margin
- Product mix
- Location comparison
Managers who want to organize these measurements in one view can also learn how real-time restaurant dashboards present sales, inventory, cost, and operational trends.
Reports should have a clear owner and review schedule. An alert that nobody is responsible for investigating has little operational value.
Daily and Weekly Food Cost Reports
Daily review should focus on information that supports immediate action. This may include receiving discrepancies, unusually high waste, stockouts, low-stock alerts, voids, comps, and large sales shifts.
Weekly review can examine broader movement:
- Inventory count results
- High-value variance
- Vendor price changes
- Purchases against budget
- Actual versus theoretical food cost
- Waste trends
- Recipe cost changes
- Menu item performance
- Par-level exceptions
Managers should document follow-up actions. A variance report becomes more valuable when the team records what was investigated and whether the issue was corrected.
Monthly Food Cost Review
Monthly review looks for patterns that may not be obvious within one week.
Owners can compare food cost percentage, purchasing, waste, inventory valuation, menu mix, and contribution margin across several periods. They can also compare results with sales volume and operational changes.
Questions to ask include:
- Which ingredients increased most in price?
- Which categories produced repeated variance?
- Did waste improve after a process change?
- Are recipe costs current?
- Which menu items lost margin?
- Did promotional sales change the menu mix?
- Are par levels still appropriate?
- Did one vendor account for unusual increases?
- Are physical counts becoming more consistent?
Monthly findings should guide specific actions such as recipe reviews, count retraining, vendor discussions, menu updates, or revised prep planning.
Multi-Location Food Cost Tracking
Multi-location reporting allows operators to review food cost performance by restaurant while maintaining shared standards.
A centralized system may contain standard ingredient records, recipes, menu mappings, count categories, and reporting definitions. Each location can then enter its own purchases, counts, waste, and operational activity.
Location-level variation is expected. Supplier prices, sales volume, menu mix, storage capacity, and customer demand can differ. The purpose of comparison is not to force identical numbers but to identify differences that need explanation.
Multi-location tools may also support consolidated purchasing, inventory transfers, role-based permissions, and standardized dashboard analytics.
Comparing Food Costs Across Locations
Location comparisons should use consistent definitions and time periods.
A restaurant with higher food cost percentage may sell more premium products or operate with different vendor pricing. A smaller location may experience more waste because it cannot purchase in the same quantities as a high-volume site.
Useful comparison measures include:
- Actual and theoretical food cost
- Variance by ingredient
- Waste per sales dollar
- Vendor prices
- Recipe adherence
- Inventory days on hand
- Stockout frequency
- Contribution margin by item
- Count completion
- Purchase volume
Managers should investigate both high and low outliers. An unusually low food cost may indicate excellent performance, but it may also reflect an inaccurate count or missing invoice.
Standardizing Recipes and Count Procedures
Multi-location data is reliable only when locations use consistent rules.
Standardization should cover:
- Ingredient names
- Purchase units
- Recipe units
- Pack sizes
- Recipe quantities
- Yield assumptions
- Menu mapping
- Waste reasons
- Count schedules
- Storage categories
- Cutoff times
- Approval procedures
Local differences should be documented instead of hidden. A location-specific vendor pack or recipe variation may require a separate item record.
Training is equally important. Managers should understand not only how to enter counts, but why timing, units, and completeness affect the final reports.
Common Mistakes in Restaurant Food Cost Tracking
Restaurant food cost software can organize data, but it cannot correct every operational weakness automatically.
Common mistakes include:
- Counting inventory inconsistently
- Leaving invoices unentered
- Using outdated ingredient prices
- Ignoring waste
- Building incomplete recipes
- Mapping POS items incorrectly
- Mixing purchase and recipe units
- Failing to account for yield
- Reviewing reports without taking action
- Tracking too many details too soon
- Relying only on total sales
- Allowing duplicate ingredient records
A reliable process starts with a manageable scope. Operators may begin with high-cost proteins, dairy, cooking oil, beverages, and other important categories before expanding.
Using Outdated Ingredient Costs
Outdated ingredient costs make recipe margins appear better or worse than current reality.
A recipe created months ago may still use the original cost of cheese, oil, meat, or produce even though supplier prices have changed. Menu pricing decisions based on that recipe can therefore be misleading.
Restaurants should decide how costs update. Some systems use the latest invoice cost, while others use an average, weighted average, or manually approved cost.
No method is automatically right for every use. The important point is to understand the system’s method and apply it consistently.
Managers should also review unusual changes before they update all recipes. A mistaken pack size or invoice quantity can create a large false increase.
Skipping Inventory Counts
Food cost tracking software still requires physical inventory counts.
Sales deductions show what should have been used. They do not confirm what remains in the building.
Without ending inventory, managers cannot calculate actual cost of goods sold reliably. They also lose the ability to compare expected and actual usage.
Counts should be scheduled consistently, ideally under similar operating conditions. High-value items may need more frequent spot counts than the full inventory.
When time is limited, a partial count of major cost items is better than abandoning the process entirely. It should not, however, be presented as a complete inventory.
Food Cost Tracking Checklist for Restaurants
The following checklist can help restaurants prepare and maintain their food cost tracking system.
| Checklist Area | What to Review | Why It Matters |
| Ingredient list | Item names, units, pack sizes, and categories | Creates accurate cost records |
| Recipe cards | Ingredients, portions, yields, and modifiers | Calculates expected menu cost |
| Vendor pricing | Current supplier and unit costs | Identifies cost changes |
| Inventory counts | Actual stock on hand | Confirms usage and valuation |
| Par levels | Target stock amounts | Reduces shortages and over-ordering |
| Waste logs | Spoilage, mistakes, and overproduction | Finds hidden losses |
| POS mapping | Menu items, recipes, sizes, and modifiers | Connects sales to usage |
| Purchase records | Orders, receipts, invoices, and credits | Confirms actual cost |
| Food cost reports | Trends, percentages, and variance | Supports management decisions |
| Menu profitability | Cost, popularity, and margin by item | Improves menu strategy |
How to Use the Checklist
Assign an owner to each area. The chef may maintain recipes, a receiving manager may verify deliveries, and a general manager may review weekly variance.
Set realistic review intervals. Ingredient prices may update with every invoice, while recipe cards may be reviewed after a supplier or menu change. Inventory counts may occur weekly, with daily spot counts for selected items.
The checklist should become part of normal operations rather than a one-time software setup project.
Managers can use it during monthly reviews to identify incomplete records and training needs. A missing process should be corrected before adding more advanced reporting.
Records to Keep for Food Cost Control
Useful records include vendor invoices, purchase orders, receiving documents, credits, inventory counts, waste logs, recipe cards, sales reports, transfer records, and manager notes.
These records explain why the numbers changed. A report may show a sharp increase in cost, while the supporting invoice reveals a temporary substitute or pack-size change.
Retention practices may be influenced by accounting, tax, legal, food-safety, or regulatory requirements. Restaurants should seek qualified professional guidance for requirements that apply to their circumstances.
Operationally, records should be organized, searchable, access-controlled, and backed up according to the software provider’s available features.
Best Practices for Tracking Food Costs with Restaurant Software
A sustainable restaurant food cost control process is built on consistent habits.
Recommended practices include:
- Set up ingredients carefully.
- Use consistent item names.
- Confirm pack sizes and units.
- Update vendor prices regularly.
- Build complete recipe cards.
- Include prep recipes and modifiers.
- Map POS items correctly.
- Count inventory on a fixed schedule.
- Record waste during the shift.
- Review high-value variance.
- Compare actual and theoretical cost.
- Use par levels for purchasing.
- Review low-margin items.
- Train managers on data entry.
- Keep dashboards focused.
- Document corrective actions.
Restaurant software should make these activities easier, not create a second operation that exists only for reporting.
Creating a Food Cost Review Routine
A practical routine can be divided into daily, weekly, and monthly activities.
Daily activities may include receiving deliveries, recording waste, reviewing low-stock alerts, entering urgent substitutions, and investigating unusual comps or voids.
Weekly activities may include physical inventory, variance review, vendor price changes, recipe cost exceptions, purchase analysis, and waste trends.
Monthly activities may include menu profitability, contribution margin, broader COGS trends, par-level updates, location comparisons, and process improvement.
The review schedule should identify who performs each task and when it is complete. Shared responsibility without ownership often leads to missing data.
Turning Food Cost Data Into Better Decisions
Data becomes useful when it changes a decision or confirms that a process is working.
Food cost information may support decisions to:
- Reduce an order quantity
- Raise or lower a par level
- Change a prep batch
- Reprice a menu item
- Update a recipe
- Retrain portioning
- Request a vendor credit
- Compare supplier options
- Improve receiving checks
- Change storage practices
- Promote a strong-margin item
- Retire a high-waste product
Managers should avoid changing several variables at once. A focused adjustment followed by measurement makes it easier to understand what improved the result.
How to Choose Restaurant Software for Tracking Food Costs
Choosing food cost tracking software requires more than comparing promotional feature lists.
The system should fit the restaurant’s menu, purchasing process, storage layout, sales channels, reporting needs, and staff capacity.
Important areas to review include:
- Ingredient-level inventory
- Recipe and batch costing
- POS integration
- Menu modifier support
- Vendor management
- Purchase orders
- Receiving
- Invoice entry or import
- Waste logs
- Par levels
- Low-stock alerts
- Actual versus theoretical reports
- Inventory valuation
- Multi-location reporting
- Data exports
- User permissions
- Mobile counting
- Training and support
- Total ongoing cost
Request a demonstration using realistic restaurant examples. Generic retail inventory may not handle recipe yields, nested preparations, portions, modifiers, or kitchen waste properly.
Questions to Ask Before Choosing Food Cost Software
Restaurant operators can ask:
- Can ingredients be purchased, counted, and used in different units?
- Does the system support recipe and batch yields?
- Can prep recipes be nested inside menu recipes?
- How are modifiers and combo meals handled?
- Which POS systems can connect?
- How often does POS data synchronize?
- Can vendor invoices update ingredient costs?
- Does the system track price history?
- Can staff create purchase orders?
- Can receiving be compared with orders and invoices?
- Are waste reasons customizable?
- Can par levels vary by location?
- Does the system calculate actual and theoretical food cost?
- Can reports be exported?
- Are user permissions available?
- Is mobile inventory counting supported?
- What training is included?
- What happens if an integration fails?
- How is historical data retained?
- What is the total cost, including setup and integrations?
A trial should include normal employees, not only senior managers. The people entering counts, receiving deliveries, and recording waste will determine whether the process remains accurate.
Comparing Accuracy, Usability, and Workflow Fit
Accuracy begins with the system’s ability to represent the restaurant’s real ingredient and recipe structure. Usability determines whether staff will maintain that structure.
A technically advanced system may fail if routine entries require too many steps. An easy system may also fail if it cannot handle yields, multiple units, modifiers, or location-specific costs.
Workflow fit can be evaluated by following a real ingredient through the system:
- Create the ingredient.
- Enter its pack size and units.
- Receive a delivery.
- Add it to a recipe.
- Sell the linked menu item.
- Record waste.
- Count remaining stock.
- Review variance.
- Update the vendor price.
- Confirm the recipe cost changed correctly.
The best restaurant software for tracking food costs should make this journey understandable and repeatable.
Frequently Asked Questions
What does tracking food costs with restaurant software mean?
It means using software to connect ingredient costs, recipes, purchases, inventory counts, waste, and menu sales. The software helps managers understand what food should cost, what it actually cost, how much inventory remains, and where differences may have occurred.
How does restaurant food cost tracking work?
The restaurant creates ingredient and recipe records, enters purchasing information, connects menu sales, records waste, and performs physical inventory counts. The software uses these records to calculate recipe costs, theoretical usage, actual food cost, inventory variance, and menu profitability.
What is food cost tracking software?
Food cost tracking software is a restaurant operations tool that helps organize ingredient pricing, inventory movement, recipe costing, purchasing, waste, and cost reports. Some platforms are stand-alone inventory systems, while others are included in broader restaurant management software.
Can restaurant food cost software help reduce waste?
Yes, it can help managers identify waste patterns, overproduction, spoilage, repeated preparation mistakes, and ingredients that remain in stock too long. The software provides visibility, but reducing waste still requires better purchasing, storage, forecasting, training, portioning, and preparation practices.
How does POS integration help track food costs?
POS integration connects each sold menu item with its recipe. The software can then estimate which ingredients should have been consumed. This creates theoretical usage that can be compared with physical inventory and recorded waste.
What reports should restaurants review for food cost control?
Useful reports include food cost percentage, actual versus theoretical cost, inventory variance, recipe cost, vendor price changes, purchase history, waste, stock levels, low-stock alerts, and menu profitability. Restaurants should begin with a focused set of reports that managers can review and act on consistently.
What mistakes should restaurants avoid when tracking food costs?
Common mistakes include inaccurate units, incomplete recipes, outdated prices, inconsistent inventory counts, unrecorded waste, incorrect POS mapping, and failure to investigate variance. Restaurants should also avoid collecting more detail than staff can maintain reliably.
How should restaurants choose software for tracking food costs?
Restaurants should compare recipe costing, inventory counts, vendor tracking, POS integration, waste logs, purchasing, reports, usability, permissions, training, support, and total cost. The selected system should fit real receiving, preparation, counting, and management workflows rather than only offering a long feature list.
Conclusion
Tracking food costs with restaurant software gives operators a clearer view of how ingredients move from supplier deliveries to storage, preparation, menu sales, and waste.
A connected system can help restaurants understand recipe costs, food cost percentage, inventory variance, vendor pricing, ingredient usage, menu profitability, and purchasing needs. It can also make recurring tasks such as inventory counts, invoice review, waste logging, and menu analysis more organized.
Software alone does not create accurate reports. Restaurants must set up ingredients carefully, use consistent units, maintain current recipes, map POS items correctly, count inventory regularly, and record waste honestly.
Managers should review actual and theoretical food cost together, investigate high-value variance, monitor supplier changes, and use menu profitability data in context. Staff training and clear ownership are equally important because reliable information depends on consistent daily entries.
The most useful restaurant food cost software is the system that fits how the kitchen and management team actually work. When technology supports practical routines rather than adding unnecessary complexity, food cost data becomes easier to trust and more useful for improving purchasing, portion control, waste reduction, and long-term operational efficiency.