

Running a restaurant requires hundreds of decisions that affect sales, staffing, inventory, service, and profitability. Owners and managers must respond to changing guest traffic, rising ingredient costs, employee availability, online orders, payment adjustments, and menu demand—often during the same shift.
Restaurant KPIs make those decisions easier by turning daily operating activity into measurable signals. Instead of relying only on instinct or waiting until the end of the month to discover a problem, operators can use restaurant performance metrics to see what is working, what is changing, and where closer attention may be needed.
A café may focus on morning order volume, beverage cost, and average ticket. A full-service dining room may watch covers, table turnover rate, labor percentage, and reservations.
A food truck may prioritize sales by location, order speed, waste, and payment mix. Multi-location operators may compare sales, prime cost, inventory variance, and customer feedback across stores.
The goal is not to monitor every available number. Effective restaurant KPI tracking begins with a manageable group of metrics that support real decisions. This guide explains the key restaurant KPIs owners should understand, how to review them, and how to use a restaurant KPI dashboard without becoming overwhelmed by reports.
What Are Restaurant KPIs?
Restaurant KPIs are measurable values used to evaluate financial, operational, and customer-facing performance. KPI stands for key performance indicator. Each indicator answers a specific question about how the restaurant is performing.
For example, gross sales show how much revenue the restaurant generated before adjustments. Restaurant food cost percentage shows how ingredient costs compare with food sales.
Restaurant labor cost percentage shows how staffing expenses relate to revenue. Average check size indicates how much guests or orders typically spend.
A useful KPI should be clearly defined, calculated consistently, and connected to an action. If labor percentage increases, managers may examine scheduling, overtime, sales volume, or clocked hours. If food cost rises, they may review vendor prices, recipes, portions, waste, and inventory counts.
KPIs are most valuable when reviewed as a connected group. Higher sales can look positive, but the picture may change if labor, food cost, delivery fees, refunds, and waste increased even faster.
Restaurant management KPIs commonly cover:
- Sales and guest traffic
- Labor and employee productivity
- Food and beverage cost
- Inventory and waste
- Menu performance
- Payment activity
- Customer experience
- Online ordering and delivery
- Profitability and cash flow
- Multi-location performance
These numbers provide general operational guidance. Accounting, tax, payroll, employment, and compliance questions should be reviewed with appropriately qualified professionals.
Restaurant KPIs vs Regular Reports
Regular restaurant reports contain raw information such as daily sales, clocked hours, item quantities, discounts, refunds, and payment totals. KPIs take selected information from those reports and turn it into measurements that are easier to compare.
A daily sales report may show $12,000 in net sales and 480 completed orders. The average ticket would be $25. That KPI gives the manager a useful basis for comparing guest spending with previous days, dayparts, or locations.
Similarly, a labor report may show total labor dollars and hours. When labor cost is divided by sales, the resulting labor percentage helps managers understand whether staffing costs remained aligned with revenue.
Reports still matter because they provide the supporting details behind each KPI. When a performance indicator changes unexpectedly, managers can return to restaurant sales reports, labor records, inventory counts, and payment reports to investigate the cause.
A helpful explanation of restaurant POS reporting can provide additional context on how raw transaction records are organized into sales, labor, menu, and payment reports.
Why KPIs Should Be Easy to Act On
A restaurant can collect hundreds of metrics, but not every metric deserves management attention. The strongest restaurant business metrics support practical questions such as:
- Should staffing be adjusted for a certain daypart?
- Are ingredient costs increasing faster than menu prices?
- Which menu items generate both popularity and contribution margin?
- Are discounts, comps, or refunds becoming unusually frequent?
- Is delivery generating worthwhile revenue after related costs?
- Are repeat visits and customer satisfaction improving?
A KPI that cannot influence a decision may be interesting, but it is unlikely to be a key indicator.
Owners should assign responsibility for reviewing each important KPI. A general manager might monitor daily sales and labor. A kitchen manager may track food cost, inventory variance, and waste. A bar manager may review beverage cost, pours, comps, and voids.
Why Restaurant KPI Tracking Matters

Restaurant KPI tracking creates visibility across areas that are otherwise easy to manage separately. Sales may be recorded in the point of sale system, labor in scheduling or timekeeping software, inventory in count sheets, and customer feedback across several ordering and review channels.
When these data sources are reviewed together, managers can understand relationships between demand, staffing, cost, and service.
For example, a busy dinner shift may produce strong gross sales but also generate overtime, long wait times, rushed portions, refunds, and negative feedback. Sales alone would suggest a successful shift. A broader KPI review might show that operational efficiency and restaurant profit margin were weaker than expected.
Tracking restaurant operations KPIs also helps managers identify problems earlier. A gradual increase in waste, voids, overtime, or order errors may not be obvious during daily service. Weekly trend reports can reveal the pattern before it becomes a larger cost.
The purpose of measurement is not to remove management judgment. KPIs provide evidence that makes judgment more informed.
Better Daily Decisions
Daily KPIs help managers respond while conditions can still be changed. Reviewing yesterday’s sales data before the next shift may show that lunch traffic was lower than forecast, online orders peaked earlier than expected, or one payment type did not reconcile correctly.
Managers can use that information to:
- Adjust station assignments
- Confirm inventory for high-demand items
- Review early clock-ins and late clock-outs
- Prepare for expected online order peaks
- Investigate refunds, voids, and cash differences
- Confirm that deposits match payment reports
- Review stockouts or unusual waste
Restaurant POS analytics are especially useful when managers can filter reports by hour, order channel, revenue center, employee, menu category, or location.
Daily reviews should remain brief. A manager who spends hours analyzing every report may lose sight of the operating floor.
Better Long-Term Planning
Daily performance can vary because of weather, local events, staffing changes, promotions, holidays, or one unusually large order. Longer reporting periods help owners separate temporary fluctuations from meaningful trends.
Weekly and monthly restaurant performance metrics can reveal:
- Seasonal changes in demand
- Dayparts that are gaining or losing traffic
- Menu categories with declining contribution margin
- Recurring overtime patterns
- Increasing food or beverage cost
- Changes in average check size
- Growing delivery or online ordering demand
- Differences between locations
- Movement in customer retention rate
- Pressure on prime cost or restaurant profit margin
Trend analysis also supports budgeting, menu updates, equipment planning, hiring, and operating-hour decisions. Owners should compare similar periods whenever possible, such as the same weekday, the same number of operating days, or the same seasonal period.
Key Restaurant KPIs Compared
The following table summarizes several important restaurant management KPIs and suggests a practical review frequency.
| KPI | What It Measures | Why It Matters | How Often to Review |
| Gross sales | Total sales before deductions | Shows overall revenue volume | Daily |
| Net sales | Sales after discounts, refunds, and other adjustments | Gives a cleaner view of earned sales | Daily |
| Average check size | Average spend per order or guest | Supports pricing and suggestive-selling decisions | Weekly |
| Food cost percentage | Food cost compared with food sales | Supports ingredient and portion control | Weekly |
| Labor cost percentage | Labor cost compared with sales | Helps align staffing with demand | Weekly |
| Prime cost | Cost of goods sold plus labor cost | Shows pressure from major controllable costs | Monthly |
| Table turnover rate | How often tables are seated during a period | Tracks dining-room capacity and service flow | Weekly |
| Inventory variance | Expected inventory compared with actual counts | Reveals waste, errors, or control gaps | Weekly |
| Void and comp rate | Adjusted or removed sales relative to activity | Highlights training and control concerns | Weekly |
| Customer retention rate | The share of customers who return | Supports loyalty and experience planning | Monthly |
Review frequency may vary according to sales volume, concept, reporting capabilities, and management needs. A high-volume bar may examine beverage cost and void activity more frequently, while a seasonal food truck may focus more heavily on sales by location and event.
How to Use the KPI Table
The table can be used to build three reporting routines.
Daily reports should focus on immediate operating signals. Net sales, order volume, cash differences, refunds, stockouts, and unusual labor activity belong in this category.
Weekly reports should support management adjustments. Average check size, food cost percentage, labor percentage, inventory variance, waste, table turns, and order accuracy can be reviewed for trends and exceptions.
Monthly reports should provide a wider view of business health. Prime cost, item profitability, restaurant profit margin, customer retention, channel profitability, and location comparisons are more useful when enough activity is included.
A KPI should not be moved to a daily report merely because software can display it in real time. Match the frequency to how quickly the restaurant can act on the information.
Why KPI Priorities Differ by Restaurant Type
A café that serves most of its guests before noon may depend heavily on peak-hour throughput, beverage cost, add-on sales, and order speed. A bar may monitor beverage cost percentage, pour consistency, comps, voids, and sales by hour.
Full-service restaurants usually place greater emphasis on covers, reservations, average guest spend, table turnover rate, labor by shift, and customer wait times. Quick-service restaurants may prioritize ticket count, drive-through or counter speed, digital order volume, order accuracy, and sales per labor hour.
Food trucks may track revenue by location, event, operating hour, menu item, payment type, and weather condition. Multi-location operators need standardized restaurant management KPIs that can be compared across locations while still recognizing differences in size, hours, menu, and market.
The right KPI set reflects the restaurant’s service model and operating priorities.
Sales KPIs Every Restaurant Owner Should Track
Restaurant sales KPIs show where revenue comes from, when it is generated, and how demand changes over time. They are often the first metrics owners review, but they should be considered alongside cost and profitability measures.
Useful sales metrics include:
- Gross sales
- Net sales
- Sales by daypart
- Sales by menu category
- Sales by order channel
- Sales by location
- Sales by employee or service area
- Discounts, refunds, and comps
- Same-period sales trends
A daily sales report should be consistent about whether taxes, gratuities, service charges, refunds, and discounts are included. Otherwise, managers may compare numbers that appear similar but are calculated differently.
Sales growth is most meaningful when owners can explain its source. Revenue might rise because guest traffic increased, prices changed, average ticket improved, a new channel was added, or the restaurant operated more hours.
Gross Sales and Net Sales
Gross sales represent the total recorded value of sales before certain deductions. Net sales generally reflect gross sales after discounts, refunds, comps, and similar adjustments, although exact definitions can vary by reporting system.
Suppose the point of sale system records $20,000 in gross sales. During the period, the restaurant also records $600 in discounts, $150 in comps, and $250 in refunds. Depending on the system’s definitions, net sales may be approximately $19,000.
Gross sales help operators understand transaction volume before adjustments. Net sales provide a more realistic starting point for evaluating labor percentage, food cost, and other performance metrics.
Owners should confirm how their restaurant reporting software treats taxes, tips, service charges, gift card sales, gift card redemptions, delivery fees, and cancelled orders.
Sales by Daypart and Channel
Total daily sales can hide important demand patterns. Daypart reporting separates revenue into periods such as breakfast, lunch, afternoon, dinner, and late night.
This can help managers identify:
- Peak hours requiring more staff
- Slow periods that may need a different menu or schedule
- Changes in lunch versus dinner demand
- Opportunities to shorten or extend operating hours
- Dayparts with unusually low average checks
Channel reporting separates dine-in, takeout, online ordering, direct delivery, third-party delivery, catering, curbside pickup, and other order sources.
A channel with strong revenue may also carry packaging costs, additional labor, commissions, refunds, or customer-service challenges. For that reason, sales by channel should eventually be paired with channel profitability.
Average Check Size and Average Ticket
Average check size, sometimes called average ticket, measures the average value of an order or guest check.
A common calculation is:
Average check size = Net sales ÷ Number of checks or orders
If a restaurant records $15,000 in net sales from 600 orders, the average ticket is $25.
Some full-service restaurants also calculate average spend per cover:
Average spend per cover = Net sales ÷ Number of guests served
The distinction matters. One check may include several guests, while one quick-service ticket may represent a single person or a family order.
Average check can be reviewed by daypart, channel, employee, menu category, or location. This provides more context than one restaurant-wide average.
Why Average Check Size Matters
Average check size shows how much revenue the restaurant generates from each transaction. Even a modest change can affect total sales when multiplied across hundreds or thousands of orders.
If a restaurant completes 1,000 weekly orders, increasing the average ticket from $24 to $25 would add $1,000 in weekly sales, assuming order volume remains stable.
However, a higher average check is not automatically positive. It might result from menu price increases while guest count is declining. It could also be influenced by a temporary catering order or an unusually large group.
Average ticket should be reviewed with covers, order volume, menu mix, and customer feedback.
How to Improve Average Check Size Responsibly
Restaurants can improve average check size by making relevant additions easy to understand rather than pressuring guests.
Practical approaches include:
- Clear menu descriptions
- Logical placement of sides and add-ons
- Beverage and dessert suggestions
- Bundled meals where appropriate
- Staff knowledge of menu pairings
- Convenient modifiers in online ordering
- Thoughtful premium options
- Accurate availability information
Managers should track whether an initiative increases revenue without reducing order speed, guest satisfaction, or contribution margin.
Covers, Order Volume, and Guest Count
Covers represent the number of guests served, particularly in full-service restaurants. Quick-service businesses, cafés, food trucks, and delivery-focused operations often rely more heavily on order count or ticket count.
Traffic KPIs show whether sales changes are driven by more customers or by changes in spending.
A restaurant can experience higher sales while serving fewer guests if menu prices or average ticket increase. It can also serve more guests without generating proportionate revenue if average spend falls.
Track the traffic measure that best reflects the service model:
- Dine-in covers
- Reservations seated
- Walk-in guests
- Takeout tickets
- Online orders
- Delivery orders
- Catering orders
- Drive-through transactions
Covers vs Sales
Sales measure revenue, while covers measure guest traffic. Reviewing both helps owners understand demand more accurately.
Suppose monthly revenue increases by 5%, but covers decline by 7%. The sales increase may have resulted from higher prices or a shift toward premium items rather than stronger traffic.
That does not necessarily indicate a problem. However, continued declines in covers could affect long-term revenue, word-of-mouth activity, and customer retention.
Owners can also calculate average sales per cover to see how much each guest contributes to revenue.
Using Guest Count to Plan Staffing
Historical guest count and order volume can improve scheduling. Managers can review traffic in 15-minute, 30-minute, or hourly intervals to identify when stations become busy.
Staffing plans may consider:
- Expected covers or tickets
- Reservation patterns
- Online order peaks
- Delivery demand
- Menu complexity
- Prep requirements
- Employee skill levels
- Local events and weather
- Closing and cleaning responsibilities
Guest count should guide staffing, but it should not be the only consideration. Some shifts require minimum coverage even when sales are low.
Table Turnover Rate
Table turnover rate measures how many times tables are seated during a defined period. It is most relevant for restaurants with limited seating, reservations, or frequent waitlists.
A simple calculation is:
Table turnover rate = Number of parties served ÷ Number of available tables
If a dining room has 20 tables and serves 60 parties during dinner, the table turnover rate is three turns per table for that period.
Some restaurants measure turns by section, table type, server, or daypart. The result can help managers understand dining-room capacity and identify service bottlenecks.
How Table Turnover Works
Table turnover is influenced by more than server speed. Host stand procedures, kitchen ticket times, payment processing, menu complexity, reservation spacing, party size, table configuration, and bussing speed all affect the metric.
Managers should review:
- Time from arrival to seating
- Time from seating to first order
- Kitchen preparation time
- Time between meal completion and payment
- Time required to clean and reset the table
- Reservation no-shows and late arrivals
A slow turn may indicate a service issue, but it may also reflect the concept. Fine dining naturally has longer table times than a casual lunch restaurant.
Balancing Speed and Hospitality
Increasing table turns should not mean rushing guests. Pressure to move customers quickly can reduce satisfaction, lower retention, and create negative feedback.
The better objective is to remove unnecessary delays. Guests may appreciate faster greeting, accurate order entry, prompt drink delivery, and convenient payment without feeling hurried.
Restaurants should compare table turnover with ratings, complaints, tips, repeat visits, and average check size. The goal is efficient service that remains comfortable and attentive.
Food Cost Percentage
Restaurant food cost percentage compares the cost of food used with the food sales generated during the same period.
A common calculation is:
Food cost percentage = Food cost ÷ Food sales × 100
Food cost may be determined through purchases or, more accurately, through inventory movement:
Beginning inventory + Purchases − Ending inventory = Cost of food used
If food used costs $15,000 and food sales total $50,000, the food cost percentage is 30%.
The percentage should be evaluated against the restaurant’s menu, portion sizes, pricing, service model, and historical results. There is no single percentage that is appropriate for every concept.
Why Food Cost Percentage Matters
Food cost directly affects restaurant profitability. A busy restaurant may generate high sales but still experience margin pressure if ingredient cost, waste, or portions are not controlled.
Owners should review food cost with menu mix. A high-cost item may still produce a strong contribution margin if its selling price generates enough gross profit dollars.
Restaurant food cost KPIs help managers evaluate:
- Ingredient purchasing
- Recipe accuracy
- Menu pricing
- Portion consistency
- Vendor changes
- Waste and spoilage
- Inventory controls
- Menu item profitability
Food cost should be calculated using consistent inventory periods and reliable sales categories.
Common Causes of High Food Cost
Food cost may increase because of:
- Vendor price increases
- Over-portioning
- Unrecorded waste
- Spoilage
- Inaccurate recipes
- Incorrect unit conversions
- Theft or unauthorized use
- Receiving errors
- Menu pricing gaps
- Heavy discounting
- Incorrect inventory counts
- Changing menu mix
Managers should investigate the source rather than assuming higher food cost is caused by kitchen performance.
Beverage Cost Percentage
Beverage cost percentage compares beverage cost with beverage sales. Bars, cafés, restaurants, and beverage-heavy concepts should often track it separately from food cost.
A general calculation is:
Beverage cost percentage = Beverage cost ÷ Beverage sales × 100
Separate categories may be useful for alcohol, coffee, fountain drinks, bottled beverages, and specialty drinks. Each category has different pricing, waste risks, recipes, and inventory methods.
Tracking Beverage Cost Separately
Combining food and beverage cost may hide problems. Strong beverage margins can make total cost appear stable even while food cost increases. The reverse can also occur if pours, spoilage, or discounts affect beverage performance.
Separate reporting helps managers evaluate:
- Alcohol pours
- Coffee recipes
- Syrup and milk usage
- Fountain drink yield
- Complimentary beverages
- Breakage and spillage
- Beverage discounts
- Inventory variance
For mixed drinks and specialty beverages, recipe consistency is essential. Small differences repeated across hundreds of orders can create meaningful variance.
Reducing Beverage Waste
Beverage waste can be managed through consistent recipes, measuring tools, accurate receiving, secure storage, and documented waste procedures.
Managers can review:
- Over-pouring
- Remade drinks
- Spills
- Expired ingredients
- Unrecorded employee drinks
- Draft system loss
- Incorrect recipes
- Complimentary items
- Inventory count differences
Waste logs should be used for improvement, not merely fault-finding. Frequent remakes may indicate training, equipment, recipe, or order-entry problems.
Prime Cost
Prime cost combines cost of goods sold and labor cost.
Prime cost = Cost of goods sold + Labor cost
Some operators also express prime cost as a percentage of sales:
Prime cost percentage = Prime cost ÷ Net sales × 100
Cost of goods sold commonly includes food and beverage usage. Labor cost may include wages and other payroll-related costs, depending on the restaurant’s reporting definition.
Because food, beverage, and labor represent major operating costs, prime cost is one of the most useful restaurant profitability KPIs.
Prime cost becomes more useful when it is reviewed alongside revenue, operating expenses, and profit. Owners who want additional context can learn how these figures connect by reviewing this guide to restaurant profit and loss statements.
Why Prime Cost Is a Core KPI
Prime cost combines two areas managers can actively monitor. Rent and certain fixed expenses may not change quickly, but scheduling, purchasing, recipes, waste, menu mix, and productivity can be reviewed regularly.
Prime cost helps answer whether sales are sufficient relative to the core resources required to produce and serve them.
A stable food cost can be offset by rising labor cost. Strong labor efficiency can be weakened by inventory waste. Prime cost brings those effects together.
Using Prime Cost Without Overreacting
Prime cost should be evaluated with context. A full-service restaurant, bar, café, food truck, and quick-service operation may have very different cost structures.
Temporary factors can also affect the result:
- Employee training
- Menu launches
- Seasonal ingredient prices
- New-location opening costs
- Unusual overtime
- Large events
- Inventory timing
- Changes in sales mix
Owners should focus on trends and investigate significant variance before making major changes.
Labor Cost Percentage
Restaurant labor cost percentage compares labor cost with sales.
Labor cost percentage = Labor cost ÷ Net sales × 100
The definition of labor cost should remain consistent. Depending on the reporting purpose, it may include hourly wages, salaries, overtime, employer-related payroll costs, benefits, bonuses, or other labor expenses.
Restaurant labor KPIs may also include:
- Scheduled hours
- Actual hours
- Overtime hours
- Labor by department
- Labor by daypart
- Sales per labor hour
- Covers per labor hour
- Schedule variance
- Employee turnover
Restaurants can strengthen labor planning by combining hourly sales, employee time records, schedules, and productivity measures. This detailed guide to labor cost analytics for restaurants explains how labor percentage, sales per labor hour, scheduling variance, and service quality can be reviewed together.
Labor reports are operational tools, not substitutes for professional payroll or employment guidance. The Department of Labor maintains restaurant and fast-food employment information, but restaurants should seek qualified review for questions affecting their specific workforce.
Scheduled Labor vs Actual Labor
Comparing scheduled and actual labor shows whether shifts operated as planned.
Differences may result from:
- Early clock-ins
- Late clock-outs
- Missed breaks
- Overtime
- Call-outs
- Shift extensions
- Unexpected demand
- Closing delays
- Schedule errors
- Training time
The purpose is not to eliminate every difference. Managers need enough flexibility to respond to real service conditions.
Repeated variance can reveal that schedules are unrealistic or that closing duties, prep tasks, and online-order demand are not fully reflected in labor plans.
Labor Cost and Service Quality
Reducing labor cost does not always improve performance. Understaffing can produce slower service, inaccurate orders, employee burnout, poor cleanliness, missed sales, and lower customer retention.
Labor should be evaluated with:
- Sales
- Guest count
- Wait times
- Order accuracy
- Customer feedback
- Employee productivity
- Overtime
- Staff turnover
- Kitchen ticket times
The objective is to align staffing with demand while protecting service and safe operating practices.
Sales per Labor Hour
Sales per labor hour measures revenue generated for each labor hour worked.
Sales per labor hour = Net sales ÷ Total labor hours
If a restaurant produces $10,000 in sales using 400 labor hours, sales per labor hour equals $25.
This metric can be calculated for the entire restaurant or by department, shift, daypart, or location.
Why Sales per Labor Hour Is Useful
Sales per labor hour helps managers understand whether staffing is aligned with revenue. It can highlight dayparts where labor remains high after customer demand slows or periods where staffing may be insufficient for order volume.
Used with historical data, it can support schedule creation and intraday labor decisions.
It may also help multi-location operators compare productivity, provided labor categories and sales definitions are standardized.
Using the Metric Carefully
A high sales-per-labor-hour figure is not always better. It may indicate efficient staffing, or it may mean employees were overloaded and service quality suffered.
The metric can be affected by:
- Weather
- Local events
- Large catering orders
- Equipment problems
- Training shifts
- Menu complexity
- Employee experience
- Delivery volume
- Unusual operating hours
Review sales per labor hour with wait time, order accuracy, customer feedback, and employee workload.
Inventory Variance and Waste KPIs
Inventory KPIs compare what the restaurant expected to use with what was actually used or counted.
Important inventory measurements include:
- Beginning and ending inventory
- Purchases
- Theoretical usage
- Actual usage
- Inventory variance
- Waste value
- Spoilage value
- Stockout frequency
- Inventory turnover
- Receiving differences
Connecting the point of sale system with inventory and scheduling tools can improve visibility. This guide to POS integration with inventory and scheduling explains how sales, ingredient usage, and staffing information can work together.
Inventory Variance
Inventory variance is the difference between expected inventory and actual inventory.
Theoretical usage is based on menu items sold and their recipes. Actual usage is determined through inventory counts and purchases. If the system predicts that 40 pounds of an ingredient should remain but the physical count shows 34 pounds, the six-pound difference requires investigation.
Possible causes include:
- Over-portioning
- Waste
- Recipe errors
- Incorrect counts
- Receiving mistakes
- Unrecorded transfers
- Theft
- Unit-conversion problems
Variance should be measured by value as well as quantity so managers can focus on the most financially significant differences.
Waste and Spoilage Tracking
Waste reports identify food or beverages that were prepared, damaged, expired, spilled, returned, or otherwise not sold.
Useful waste categories include:
- Preparation waste
- Spoilage
- Overproduction
- Incorrect orders
- Customer returns
- Equipment failure
- Quality rejection
- Portion mistakes
A waste log should record the item, quantity, reason, shift, and approximate value. Trends can guide changes to ordering, prep levels, storage, recipes, training, or equipment maintenance.
Menu Performance KPIs
Menu performance metrics show which items sell, which items contribute profit, and which items create operational difficulty.
Important menu KPIs include:
- Item quantity sold
- Item sales
- Food cost per item
- Contribution margin
- Category sales
- Modifier sales
- Attach rate
- Refund or remake frequency
- Preparation time
- Item availability
Contribution margin is generally calculated as the selling price minus the variable cost associated with the item. It helps show how many gross profit dollars an item contributes before broader operating expenses.
Best-Selling Items
Best-selling items reveal what guests prefer, but popularity should not be evaluated alone.
A popular item with high food cost, heavy prep requirements, frequent remakes, or limited contribution margin may create operational pressure. A moderately popular item with strong contribution margin may contribute more effectively to restaurant profitability.
Review high-volume items for:
- Cost changes
- Portion consistency
- Prep capacity
- Modifier demand
- Availability
- Guest feedback
- Contribution margin
Popular items should also receive strong inventory attention because stockouts can affect customer satisfaction and sales.
Low-Performing or Low-Margin Items
Weak menu items may require different responses depending on the cause.
Owners may consider:
- Improving the description
- Repositioning the item
- Adjusting the recipe
- Reviewing portion size
- Changing the price
- Simplifying preparation
- Promoting it to a relevant audience
- Removing it from the menu
Removal should not be based on sales volume alone. An item may support dietary needs, menu variety, or group purchasing decisions even if it is not a top seller.
Payment and Cash Control KPIs
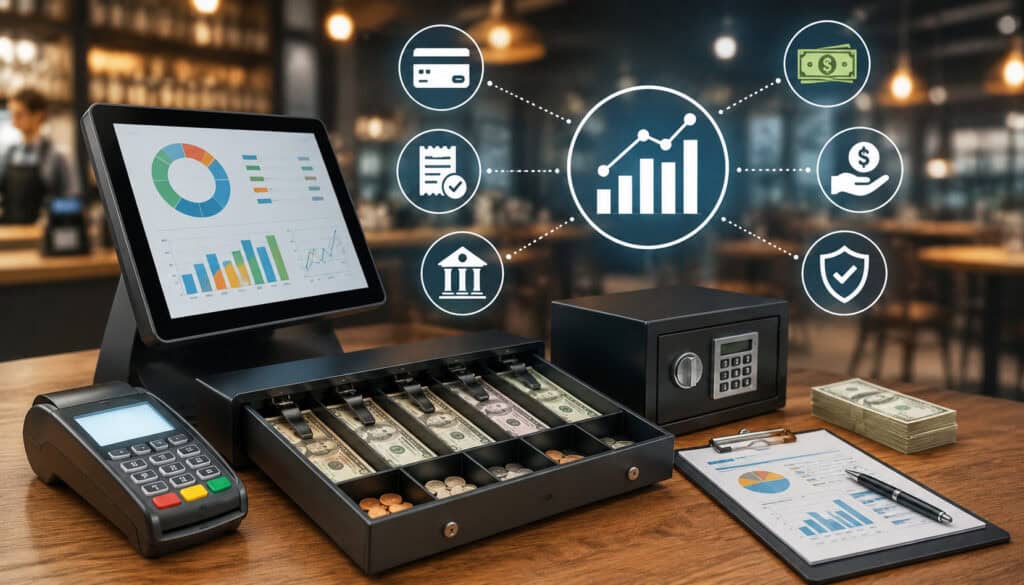
Payment reports help restaurant owners confirm that recorded sales, collected payments, deposits, refunds, and adjustments are consistent.
Common payment and cash-control KPIs include:
- Cash over or short
- Payment mix
- Refund rate
- Void rate
- Comp rate
- Chargeback activity
- Tip totals
- Deposit differences
- Declined payments
- Reconciliation exceptions
Access to payment information should be limited according to job responsibilities. Restaurants handling payment card data can consult official merchant payment-security resources for information about people, processes, technology, and data protection.
Cash Over and Short
Cash over and short measures the difference between the cash that should be present and the amount actually counted.
Frequent differences may result from:
- Incorrect change
- Counting mistakes
- Unrecorded cash movement
- Wrong payment type selection
- Shared drawers
- Poor closing procedures
- Training gaps
- Control problems
Management should review patterns by shift, drawer, and process while following appropriate workplace policies. One small difference may be accidental; repeated differences require closer review.
Refunds, Voids, and Comps
Refunds, voids, and comps reduce or adjust recorded sales. They are normal in restaurant operations but should be reviewed for reason, frequency, value, and authorization.
A rising adjustment rate may indicate:
- Order-entry errors
- Poor menu knowledge
- Kitchen mistakes
- Guest dissatisfaction
- Unclear policies
- Excessive discounting
- Unauthorized activity
- System configuration problems
Managers should use consistent reason codes so reports show why adjustments occurred.
Customer Experience KPIs
Customer experience metrics show whether guests are receiving reliable service and whether they are likely to return.
Useful measures include:
- Customer retention rate
- Repeat visit frequency
- Loyalty participation
- Ratings and review trends
- Complaint categories
- Order accuracy
- Wait time
- Kitchen ticket time
- Refund rate
- Reservation no-shows
- Customer feedback response time
No single metric fully represents customer experience. Ratings may be influenced by a small number of vocal customers, while retention data may be incomplete if guests are not identified across channels.
Customer Retention Rate
Customer retention rate estimates the percentage of customers who continue returning during a defined period.
One general formula is:
Retention rate = (Customers at end of period − New customers acquired) ÷ Customers at start of period × 100
Restaurants may also use loyalty visits, identified transactions, reservation histories, or online ordering accounts as practical retention indicators.
Retention should be paired with guest satisfaction. Repeat visits may result from convenience, but long-term loyalty is stronger when customers consistently receive good food, accurate orders, and respectful service.
Order Accuracy and Wait Time
Order accuracy measures how often customers receive what they ordered. Wait-time metrics may include time to seating, order entry, food preparation, pickup, or delivery.
Errors and delays can lead to:
- Refunds
- Remakes
- Waste
- Negative feedback
- Lower tips
- Lost repeat business
- Delivery complaints
Managers should separate delays by stage. A long total wait could be caused by host stand congestion, kitchen production, packaging, courier pickup, or payment processing.
Online Ordering and Delivery KPIs
Online ordering and delivery can increase order volume, but digital sales should be reviewed separately from dine-in activity.
Important online and delivery KPIs include:
- Digital order count
- Online revenue
- Average digital order value
- Cancellation rate
- Refund rate
- Order accuracy
- Preparation time
- Delivery time
- Packaging cost
- Channel fees
- Customer complaints
- Repeat digital orders
Accurate channel reporting is easier when online orders flow directly into the point of sale system instead of being entered manually. Restaurants reviewing digital order metrics can learn more from this guide to restaurant POS integration with online ordering.
Digital channels may have different menus, prices, modifiers, labor requirements, and customer expectations.
Online Order Volume and Revenue
Owners should track digital orders by platform, daypart, menu category, and location.
A rise in online revenue may require:
- Additional kitchen capacity
- Dedicated packaging stations
- Better pickup organization
- Inventory adjustments
- More accurate prep-time settings
- Changes to staffing
Digital sales should also be compared with dine-in demand to determine whether they are incremental or replacing another channel.
Delivery Profitability
Delivery revenue does not show the complete financial result. Owners should consider commissions or fees, packaging, refunds, promotions, additional labor, and remakes.
A channel may generate strong gross sales but a lower contribution after related costs.
Delivery should also be evaluated for guest experience. Packaging quality, menu suitability, preparation timing, order accuracy, and handoff procedures can affect satisfaction even when the restaurant does not control the entire delivery process.
Multi-Location Restaurant KPIs
Multi-location reporting gives owners a broader view of performance while allowing each manager to understand local results.
Common location-level metrics include:
- Net sales
- Sales growth
- Covers or orders
- Average check
- Labor percentage
- Food and beverage cost
- Prime cost
- Inventory variance
- Waste
- Refunds and voids
- Customer feedback
- Digital sales mix
A centralized restaurant KPI dashboard can make trends easier to identify, but consistent data definitions are essential.
Comparing Locations Fairly
Locations should not be ranked without context. Performance can be affected by:
- Seating capacity
- Operating hours
- Menu differences
- Neighborhood demand
- Delivery availability
- Local events
- Building layout
- Employee experience
- Rent structure
- Seasonality
Owners may compare each location with its own prior performance before comparing it with the group average.
Standardizing KPI Definitions
Multi-location operators should standardize:
- Reporting periods
- Sales categories
- Menu categories
- Labor departments
- Discount and comp codes
- Waste reasons
- Inventory units
- Cost calculations
- Channel definitions
Without standard definitions, one location may appear stronger simply because it classifies sales or expenses differently.
Restaurant KPI Dashboard and Reporting Tools
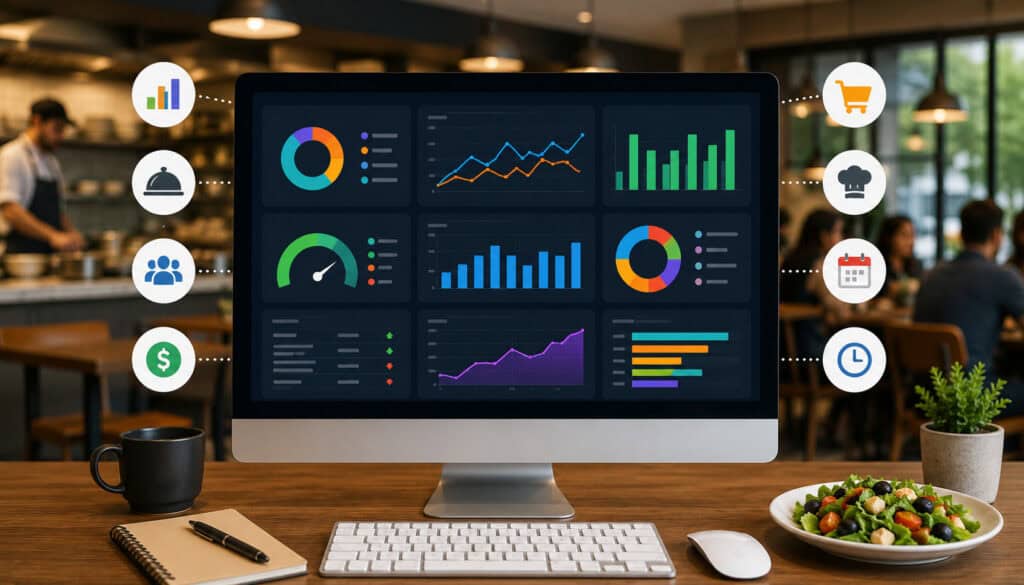
A restaurant KPI dashboard brings selected performance indicators into one view. It may combine data from restaurant POS analytics, scheduling, inventory, online ordering, payment, and customer systems.
A dashboard should reduce the time required to find meaningful information. It should not replace detailed reports or manager judgment.
Useful restaurant reporting software should help operators move from a high-level KPI to the transactions or records supporting it.
What a Restaurant KPI Dashboard Should Show
A practical dashboard may display:
- Gross and net sales
- Sales versus forecast
- Covers or order count
- Average check size
- Labor cost percentage
- Sales per labor hour
- Food and beverage cost
- Prime cost
- Inventory alerts
- Waste
- Voids, comps, and refunds
- Customer feedback
- Location comparisons
Role-based dashboards may be more useful than one universal screen. A kitchen manager needs different information from an owner or front-of-house manager.
Avoiding Dashboard Overload
Too many charts can make important signals harder to notice. Start with five to ten key restaurant KPIs that reflect current priorities.
Each dashboard item should answer:
- What does this measure?
- Who reviews it?
- How often is it reviewed?
- What range is expected?
- What action follows an exception?
Add more metrics only when the team can use them consistently.
Common Restaurant KPI Tracking Mistakes
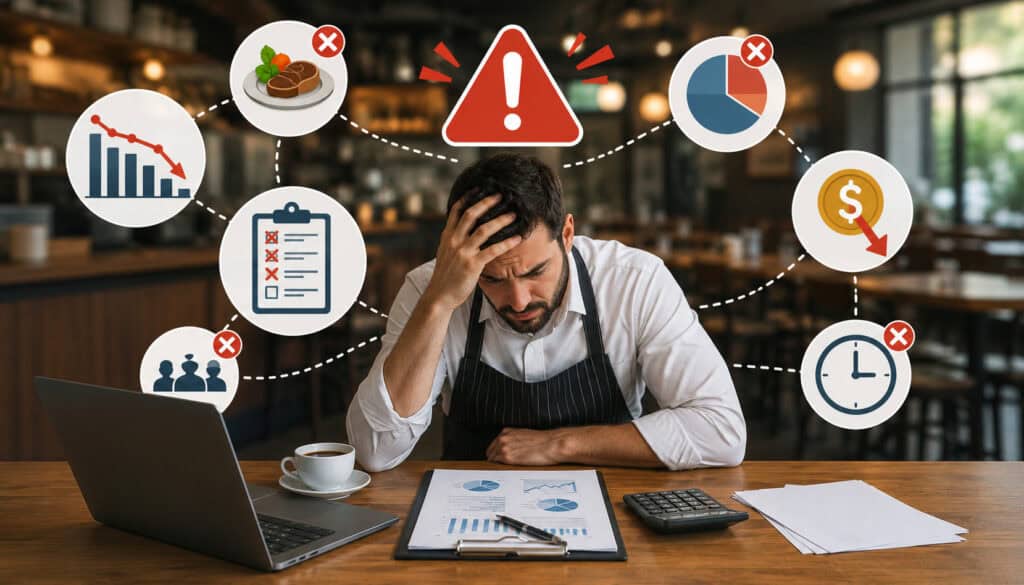
KPI tracking can fail when definitions are inconsistent, data is incomplete, or managers collect numbers without changing decisions.
Common mistakes include:
- Tracking too many metrics
- Focusing only on sales
- Ignoring labor and food cost
- Using inconsistent reporting periods
- Comparing unlike locations
- Relying on inaccurate recipes
- Ignoring refunds and voids
- Making decisions from one unusual day
- Failing to train managers
- Treating targets as universal rules
Data quality should be reviewed regularly. Incorrect menu categories, shared employee accounts, incomplete waste logs, and inconsistent inventory units can weaken reports.
Tracking Metrics Without Taking Action
A KPI report has limited value when it is reviewed and filed without discussion.
Managers should turn significant findings into specific actions. For example:
- Rising overtime may lead to schedule changes.
- High waste may lead to smaller prep batches.
- Low add-on sales may lead to menu or training changes.
- Frequent refunds may lead to an order-accuracy review.
- Slow table turns may lead to a service-flow analysis.
Assign an owner and review date for each action.
Comparing Numbers Without Context
Weather, holidays, promotions, local events, menu changes, equipment failures, staffing shortages, and price changes can all affect performance.
Managers should record short operational notes with KPI reports. A note explaining that a storm closed the patio or that a large catering order affected average ticket can prevent misleading comparisons later.
Restaurant KPI Tracking Checklist
The following checklist provides a manageable starting point.
| KPI Area | Metric to Track | Review Frequency | Why It Matters |
| Sales | Gross sales and net sales | Daily | Tracks revenue activity |
| Guest traffic | Covers or order count | Daily or weekly | Shows demand |
| Average spend | Average check size | Weekly | Supports menu and pricing decisions |
| Food cost | Food cost percentage | Weekly or monthly | Controls ingredient cost |
| Labor | Labor cost percentage | Weekly | Supports staffing decisions |
| Inventory | Inventory variance | Weekly | Reveals waste or errors |
| Menu | Item profitability | Monthly | Improves menu planning |
| Payments | Voids, comps, and refunds | Weekly | Supports management controls |
| Customers | Retention and feedback | Monthly | Shows loyalty and satisfaction |
| Profitability | Prime cost and margin | Monthly | Tracks overall business health |
How to Use the Checklist
Create a simple review rhythm:
Daily
- Net sales
- Covers or orders
- Payment reconciliation
- Refunds and voids
- Labor exceptions
- Stockouts
- Customer-service issues
Weekly
- Average check
- Labor percentage
- Food and beverage cost
- Inventory variance
- Waste
- Sales by daypart and channel
- Order accuracy
Monthly
- Prime cost
- Menu contribution margin
- Restaurant profit margin
- Customer retention
- Location comparisons
- Channel profitability
- Long-term sales trends
Records to Keep With KPI Reports
Supporting records may include:
- Restaurant sales reports
- Labor reports
- Time records
- Inventory counts
- Purchase records
- Waste logs
- Menu reports
- Payment reports
- Refund and void details
- Customer feedback
- Manager notes
Retention requirements can vary according to the type of record and applicable rules. Restaurants should obtain professional guidance for legal, tax, accounting, payroll, employment, and compliance questions.
Best Practices for Tracking Restaurant KPIs
Restaurant KPI tracking works best when it becomes part of normal management rather than a separate administrative project.
Effective practices include:
- Start with a small set of key restaurant KPIs.
- Review sales and payment reports daily.
- Review labor and food cost regularly.
- Compare trends over time.
- Use consistent reporting periods.
- Train managers on KPI meanings.
- Keep point of sale data organized.
- Track both revenue and profitability.
- Review voids, comps, and refunds.
- Verify reports with inventory counts.
- Connect scheduling with labor KPIs.
- Review menu performance monthly.
- Protect employee and customer data.
- Avoid reacting to one unusual day.
- Seek qualified guidance for specialized questions.
Creating a KPI Review Routine
A good routine assigns frequency, responsibility, and action.
Daily reviews may be completed by the opening or closing manager. Weekly reviews may involve the general manager, kitchen manager, and front-of-house manager. Monthly reviews may include ownership and location leaders.
Keep meetings focused. Review exceptions, trends, causes, and actions rather than reading every number aloud.
A successful routine creates continuity. The team should be able to see what was discussed previously, what action was assigned, and whether the result improved.
Turning KPIs Into Better Decisions
KPIs should influence real operations.
Sales by hour can improve scheduling. Food cost and contribution margin can guide menu changes. Inventory variance can strengthen receiving and portion controls. Customer feedback can identify training needs. Refund data can reveal order-entry or packaging problems.
The process is:
- Identify the change.
- Verify the data.
- Investigate likely causes.
- Choose a practical action.
- Assign responsibility.
- Review the result.
This prevents managers from making broad changes before understanding the underlying issue.
How to Choose Restaurant Reporting Software for KPI Tracking
Restaurant reporting software should make performance information accurate, accessible, and understandable.
Before selecting a system, determine which decisions the restaurant needs to support. A sophisticated dashboard is not useful if it cannot separate dine-in and delivery sales, connect labor with revenue, or export clean records.
Review capabilities such as:
- Point of sale analytics
- Daily sales reports
- Labor reporting
- Inventory reports
- Food cost tracking
- Menu performance
- Payment reports
- Online ordering data
- Multi-location reporting
- Custom date ranges
- Role-based permissions
- Data exports
- Integrations
- Mobile access
- Training and support
Restaurants preparing to change systems may also find this guide to switching POS systems without disrupting service useful when planning data migration, testing, and staff preparation.
Questions to Ask Before Choosing KPI Reporting Tools
Ask potential providers:
- Can sales be filtered by daypart, channel, item, category, employee, and location?
- Can gross sales and net sales definitions be customized or explained?
- Does the system compare scheduled and actual labor?
- Can it calculate food cost from recipes and inventory?
- Does it show theoretical versus actual inventory usage?
- Can menu contribution margin be reviewed?
- Are voids, comps, discounts, and refunds easy to audit?
- Can online and delivery sales be separated?
- Can dashboards be customized by role?
- Are reports exportable?
- How are multiple locations standardized?
- What permissions protect sensitive data?
- Which integrations are supported?
- What training and support are included?
- What is the total ongoing cost?
Request a demonstration using realistic restaurant scenarios rather than generic sample charts.
Choosing Clarity Over Complexity
The best reporting tool is not necessarily the one with the most charts. It is the one managers can use accurately and consistently.
A clear dashboard with eight actionable KPIs may be more valuable than a complex system containing hundreds of measures no one reviews.
Evaluate whether managers can:
- Find information quickly
- Understand definitions
- Investigate exceptions
- Compare consistent periods
- Export supporting records
- Control access
- Take action confidently
Technology should simplify restaurant KPI tracking rather than create another source of confusion.
Frequently Asked Questions
What are restaurant KPIs?
Restaurant KPIs are measurable indicators that show how a restaurant is performing in areas such as sales, labor, food cost, inventory, menu performance, customer experience, payments, and profitability.
They help owners and managers move beyond raw reports by focusing attention on the numbers most useful for decisions.
What are the most important restaurant KPIs to track?
The most important metrics usually include net sales, covers or order volume, average check size, food cost percentage, labor cost percentage, prime cost, inventory variance, menu contribution margin, payment adjustments, and customer retention.
The right mix depends on the concept. A bar, café, full-service restaurant, food truck, and delivery-focused kitchen may emphasize different measures.
Why is restaurant KPI tracking important?
Restaurant KPI tracking helps managers see changes in demand, cost, productivity, service, and profitability earlier. It also creates a consistent basis for staffing, purchasing, menu, training, and customer-experience decisions. Trends are generally more informative than isolated results.
What restaurant performance metrics help control costs?
Food cost percentage, beverage cost percentage, labor percentage, prime cost, inventory variance, waste, overtime, sales per labor hour, and item contribution margin are especially useful for cost control.
These metrics should be investigated together. A cost may rise because of sales mix, pricing, training, vendor changes, or temporary operating conditions.
How often should restaurant owners review KPIs?
Sales, order volume, labor exceptions, and payment issues may be reviewed daily. Food cost, labor percentage, inventory variance, average check, and waste are often reviewed weekly.
Prime cost, profit margin, customer retention, menu profitability, and multi-location trends are usually more meaningful monthly. Frequency should reflect the restaurant’s volume and ability to act.
What is a restaurant KPI dashboard?
A restaurant KPI dashboard is a reporting view that displays selected performance indicators in one place. It may show sales, labor, food cost, average ticket, order volume, refunds, inventory alerts, and customer feedback. The most effective dashboards prioritize a manageable number of actionable measurements.
How do restaurant POS analytics help owners track KPIs?
Restaurant POS analytics organize transaction data into reports by item, category, employee, daypart, channel, and location. This information can be used to calculate net sales, average ticket, menu performance, order volume, discounts, refunds, and other restaurant sales KPIs. Integrations may add labor, inventory, and online ordering information.
Conclusion
Restaurant KPIs help owners and managers understand the business beyond the total at the bottom of a daily sales report. They show how revenue connects with guest traffic, average check size, labor, food cost, inventory, menu performance, payments, customer experience, and profitability.
The most effective approach is to begin with a practical set of key restaurant KPIs. Review sales and payment exceptions daily, labor and cost indicators regularly, and broader profitability trends over longer periods.
Consistent definitions and clean data are essential. Managers should understand what each metric measures, where the data comes from, and what action may follow a meaningful change.
Owners should also compare trends with context. Weather, local events, menu changes, staffing conditions, promotions, and operating hours can influence results. One number rarely tells the entire story.
A focused restaurant KPI dashboard, reliable restaurant reporting software, and a consistent management routine can make performance easier to understand.
When restaurant performance metrics are used thoughtfully, they help teams make better daily decisions, plan more confidently, protect service quality, and identify opportunities for sustainable operational improvement.